Rolf HOFFMANN TrichoScan: combining epiluminescence microscopy with digital image analysis for the measurement of hair growth in vivo
Hair loss or hair thinning is a common complaint in clinical dermatology,and patients seeking advice for hair loss are not necessarily bald. Also theeffects of treatment attempts are hard to measure. Consequently, there is aneed for a sensitive tool to monitor hair loss and treatment response. Such amethod must be able to analyze the biological parameters of hair growth,which are: 1: hair density (n/cm2), 2: hair diameter (µm), 3: hair growth rate(mm/day) and 4: anagen/telogen ratio. Here we present the TrichoScan as amethod which combines epiluminescence microscopy (ELM) with automa-tic digital image analysis for the measurement of human, and potentiallyanimal hair, in situ. The TrichoScan is able to analyze all biological parame-ters of hair growth with a so-called intraclass correlation of approx. ninety-one percent with the same TrichoScan operator and an intraclass correlationof approx. ninety-seven percent for different TrichoScan operators. Theapplication of the technique is demonstrated by comparison of the hair para-meters in individuals without apparent hair loss with men with untreated
AGA and men after treatment with finasteride (1 mg/day), where we were
logy, Philipp University, Deutschhaus-straße 9, 35033 Marburg, Germany.
able to detect a significant increase in hair counts and cumulative hair thick-ness 3 and 6 months after treatment. The advantage of the TrichoScan is
that it can be used for clinical studies to compare placebo versus treatment
or to compare different capacities of different hair growth promoting sub-
stances, it can be used for studying AGA or other forms of diffuse hair loss,
and it can be adopted to study the effect of drugs or laser treatment on
Net: http://www.med.uni-marburg.de/hautklinik
hypertrichosis or hirsutism. (Key words: hair, alopecia, computer analysis.)
Hair loss or hair thinning is a common complaint in (mm/day) and 4: anagen/telogen ratio. This paper des-
clinical dermatology and patients seeking advice
cribes the TrichoScan as such a method which combines
for hair loss are not necessarily bald. In established
standard epiluminescence microscopy (ELM) with automa-
cases of androgenetic alopecia (AGA) characteristic pat-
tic digital image analysis for the measurement of human,
terns are easily discernible. However, especially in females
and potentially animal hair, in situ. The application of the
the clinician is often challenged by patients with initial
technique is demonstrated by comparison of the aforemen-
stages of AGA where hair loss is reported but alopecia is
tioned hair parameters of individuals without apparent hair
not recognizable or the effect of treatment attempts are
loss with men with untreated AGA and men after treat-
hard to measure. Consequently, there is a need for a sensi-
tive tool to monitor hair loss and treatment response. Numerous methods have been reported [1] to assess the rateof hair growth. The techniques can be classified as either
Materials and methods
invasive (e.g. biopsies [2, 3]), semi-invasive (trichogram [4,5], unit area trichogram [6]) or non-invasive (e.g. global
Volunteers and patients
hair counts [7], phototrichogram [8-13]) methods. Quantita-tive methods for the analysis of human hair growth and hair
A total of 56 persons (25 females, age range 25-48 years,
loss are necessary to determine the efficacy of hair promo-
mean 34 years; 31 males, age range 26-39 years, mean
ting drugs, and while reviewing the capabilities of the diffe-
32 years) underwent the study. Ten out of fifty-six volun-
rent methods, the common theme emerges that most tech-
teers (5 females, age range 25-48 years, mean 34 years;
niques are of little use to the clinician because they are time
5 males, age range 26-39 years, mean 32 years) were
consuming, often costly or difficult to perform [14, 15].
recruited for the initial experiments to analyse the reprodu-
Therefore, an operator- and patient-friendly, inexpensive,
cibility of the method. The measured parameters were hair
validated and reliable method is a rational need.
thickness and hair numbers at the occiput.
Such a method must be able to analyze the biological
Seventeen male patients (age range 25-48 years, mean
parameters of hair growth, which are: 1: hair density
34 years), who had recognized progressive thinning of hair
(n/cm2), 2: hair diameter (µm), 3: hair growth rate
and hair loss for more than four years were included to
EJD n° 4, vol. 11, July-August 2001
analyse the progression of AGA with and without treat-ment. All patients presented the clinical finding of mild tomoderate AGA with various degrees of involvement, thatwere classified according to the Hamilton scale [16] (II-V). Subjects with other forms of alopecia were excludedfrom the study. Twelve of 17 male patients with AGAwere treated with Propecia® (1 mg finasteride/day) for sixmonths. All patients actively treated had had no treatmentwhatsoever for hair loss at least one month before initia-ting this study. Eleven of fifty-six healthy male volunteers(age range 28-55 years, mean 36 years) who had experien-ced no episodes of hair thinning or hair loss, recent ill-nesses or general health disturbances, were recruited as acontrol group. Clinical examination revealed no evidenceof any hair disorder with either the female or the malevolunteers. The measured parameters were hair thicknessand hair numbers at the vertex. For the analysis of daily hair growth and the anagen/telogenratio, 18 additional volunteers with AGA were recruited. Clipping of hairs
In individuals affected by AGA, a transitional area of hairloss between normal hair and the balding area was definedand an area of 1.8 cm2 was clipped (Hairliner, Wella Ger-many) (Fig. 1A-D). In volunteers without AGA (controls)the vertex was chosen for clipping. All clipped areas weremarked with a central, single black tattoo. The tattoo wasvisible throughout the study. In those 18 volunteers whowere recruited for the analysis of the anagen/telogen ratiothe scalp was clipped at two locations (vertex and occiput)and was analysed by 2 investigators with the TrichoScansoftware.
Epiluminescence microscopy (ELM) of clipped hairs
Gray or fair hairs have only limited contrast in comparisonto the scalp. Therefore, the clipped hairs within the targetarea were dyed for 12 min (Fig. 1E-H) with a commer-cially available solution (RefectoCil®, Gschwentner,Vienna, Austria), which is normally used for the coloring
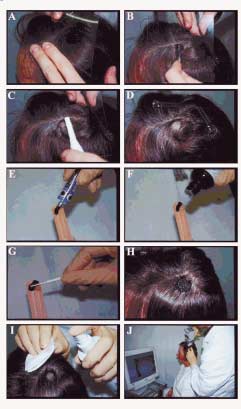
Figure 1. This is a stepwise illustration of the complete Tri-
of eye brows or lashes. The approach of dyeing the hairs
choScan procedure. A: a representative area of the scalp is
for hair growth studies has been described as giving the
chosen and the plastic template is applied; B: all hairs are
same results as uncolored hairs [17]. For the analysis of
carefully combed through the plastic template; C: the hairs
hair number and thickness the hairs were colored imme-
are shaved on the scalp surface; D: the shaved area is
diately after shaving and for the analysis of the hair
1.8 cm2 in size; E: 1 cm of dye is applied onto a wooden
growth rate and anagen-telogen ratio the hairs were colo-
stick; F: 3 drops of developer are mixed (G) with the dye; H:the dye is carefully applied onto the shaved area; I: after
Thereafter, the colored area was cleaned (Fig. 1I) with an
12 min the dye is carefully removed with an alcoholic solu-
alcoholic solution (Kodan® Spray, Schülke & Mayr,
tion; J: digital images are taken at 20- and 40-fold magnifi-
Vienna, Austria) and digital images were obtained at 20-
cation while the area is still wet.
fold (analyzed area: 0.62 cm2) and 40-fold (analyzed area:0.225 cm2) magnification by means of a digital ELM sys-
Software for digital image and statistical analysis
tem (Fotofinder DERMA, Teachscreen Software, BadBirnbach, Germany) while the area was still wet (Fig. 1J).
For the measurement of hair density (n/cm2), hair diameter
This digital camera is equipped with a rigid contact lens
(µm), hair growth rate (mm/day) and anagen/telogen ratio,
which ensures that the images are always taken at the
software was developed (TrichoScan) to analyze these
same distance from the scalp. Due the fact that the camera
parameters (Fig. 2). The software works step by step
must be pressed onto the scalp, the hairs are always flatte-
1. Selection of color component; 2. Artifact rejection
Images were taken at day zero immediately after clipping,
(bubbles and reflections); 3. Determination of threshold; 4.
two and three days after clipping, and three and six
Thresholding; 5. Labeling – Definition of hair regions; 6.
months after the initial visit, respectively. Two different
Deselecting of small regions (smaller than minimal hair
investigators each took three images from the same patient
length); 7. Tattoo elimination (works by using the fact that
the tattoo is a large, dark region located in the center of the
EJD n° 4, vol. 11, July-August 2001
Figure 2. Example of theTrichoScan analysis ofhair number, hair density,cumulative hair thicknessand anagen/telogen ratio. The figure illustrates adigital image taken at 20-fold magnification (leftside of the image) andshows the area of 0.65 cm2(blue circle) which is ana-lyzed with the TrichoScansoftware. The TrichoScanresults are illustrated onthe right side, where thedetected hairs are illustra-ted with different colors. Red hairs are non-growinghairs (telogen), greenhairs are growing hairs(anagen) and yellow hairstouch the borders of thecircle. The right lowerpart of the figure shows ahistogram of the differenthair lengths detected bythe TrichoScan software.
image); 8. Analysis of each hair region: a. Search for the
Precision and sensitivity
longest straight line (fulfilling several predefined condi-tions) at the edge of the analysed hair region, b. Reduction
The algorithm excludes all air bubbles, dust, small hae-
of hair region of detected hair; 9. Repetition of steps 8a and
mangiomas, nevi, scales, etc., from the calculation without
8b until no more hair is found; 10. Repetition of analysis of
interfering with the number of detectable hairs. In doing
all hair regions; 11. Calculation of number of hairs, hair
so, only hairs are counted and the precision of the method
density, and mean/median hair thickness/sum of hair thick-
is therefore approximately 100%. The detection limit of
ness. The software was validated by use of more than 500
the software is 5 µm in thickness. Hairs smaller than 5 µm
images, which were taken from the study participants. Measurement of hair thickness and hair number Total time “hands-on” for TrichoScan operator
In 10 volunteers the hair number (Fig. 3) and cumulativehair thickness (Fig. 4) was analysed in the same area,
The complete procedure was finished within 15-20 min.
three times by the same investigator. The percentage of
The total time “hands-on” for the TrichoScan operator was
variation in hair count between volunteers or so-called
approx. eight to twelve min (Fig. 1A-J and Fig. 2).
intraclass correlation, is estimated at 90.9%. The intra-class correlation for the cumulative hair thickness is
Effect of the hair dye
In preliminary experiments we tried to analyse fair or gray
hair with the TrichoScan software. However, these hairs
In 5 volunteers the hair number (Fig. 5) and cumulative
produced only little contrast and coloring the hairs resulted
hair thickness (Fig. 6) was analysed in the same area once,
in a marked increase in hair detectability and did not inter-
but by two independent investigators. The intraclass corre-
fere with the four basic parameters of hair growth. The
lation is estimated for the hair count at 97.6%, for the
dye must be applied for 11-13 min. More than 13 min will
unintentionally dye the scalp skin. Less than 11 minresults in incomplete staining of hairs. Analysis of total hair counts and cumulative hair thicknessin volunteers without AGA, with untreated AGA, and AGAEffect of the tattoo treated with finasterideIn individuals affected by AGA, a transitional area of hair
In the experiments presented here we used a single black
loss between normal hair and the balding area was defined
tattoo. During the analysis it became clear that the black ink
and area of 0.225 cm2 was analysed at 40-fold magnifica-
interfered with the detectability of the stained hairs. There-
tion. Twelve men were treated with finasteride, whereas
fore, in future studies we will use red ink for the tattoo. EJD n° 4, vol. 11, July-August 2001
Figures 3-6. The intra-classcorrelation of three differentmeasurements in 10 volun-teers (subjects) from thesame investigator is shownfor hair counts (Fig. 3) andfor cumulative hair thick-ness (Fig. 4). The intra-class correlation of onemeasurement in 5 volunteers(subjects) from two differentinvestigators is shown forhair counts (Fig. 5) and forcumulative hair thickness(Fig. 6).
For both variables the differences between the results
In 11 volunteers without AGA (controls) we observed no
after 3 months (6 months) and the baseline were calcula-
significant difference in the cumulative hair thickness
ted. These differences were analysed using a one-sample
within the observation time of 6 months (Fig. 8), whereas
untreated men showed a continuous and significant
In controls and untreated men we noticed no significant
decrease in the overall thickness of hairs 3 and 6 months
difference in the number of hairs within the observation
after the initial visit (Fig. 8 and Table I). By contrast, men
time of 6 months. By contrast, men treated with finasteride
treated with finasteride showed a continuous and signifi-
showed a continuous increase at 3 months (p = 0.055) and
cant increase in the number of hairs within the analysed
at 6 months (p = 0.021) in the number of hairs within the
area (Table I) after 3 (p = 0.034) and 6 months (p = 0.006)
analysed area (Fig. 7 and Table I).(Fig. 8), compared to the values obtained at baseline. Variable EJD n° 4, vol. 11, July-August 2001
Figures 7 and 8. Hair counts and cumulative hair thickness were analysed for 6 months in 11 volunteers without AGA, in5 untreated men with AGA, and in 12 men treated with finasteride (1 mg/day). In controls and untreated men we noticed nosignificant difference in the number of hairs within the observation time of 6 months (between the values at baseline and after6 months). In contrast those men treated with finasteride showed a continuous increase (mean with 95% confidence interval) at3 months (p = 0.055) and at 6 months (p = 0.021) in the number of hairs within the analysed area compared to the values atbaseline. Untreated men showed a continuous and significant decrease in the overall thickness of hairs 3 and 6 months after theinitial visit (baseline). In contrast those men treated with finasteride showed, in comparison with the baseline visit, a continuousand significant increase in the number of hairs within the analysed area after 3 (p = 0.034) and 6 months (p = 0.006).Analysis of anagen/telogen ratio and hair growth rate atDiscussion the vertex and the occiput in volunteers with AGAThe analysed variables were the portion of anagen hairs
Numerous hair diseases such as scarring alopecias, alopecia
(growing hairs) and the hair growth rate (difference of the
areata or trichotillomania, usually do not need a quantita-
length of anagen hairs minus the length of telogen hairs
tive method to evaluate the amount of hair shedding.
divided by the time of measurement after clipping. The
Androgenetic Affluvium, however, the most common form
telogen hairs are defined as non-growing hairs. Telogen
of hair loss, is typically difficult to quantify and at present
and catagen hairs cannot be differentiated).
simple but reliable procedures have not been developed.
For both variables an ANOVA was calculated with the
Although scalp biopsies can be justified in that microscopic
fixed factors diagnosis (AGA/control) and investigator
examination of scalp skin affected by AGA can identify
(investigator 1/investigator 2) and the random factor loca-
and quantify any changes resulting from treatment, this
tion nested under the diagnosis. The p-values were given
invasive technique is often not suitable to monitor patients
for the two-sided problem. Figure 9 shows the original
over a prolonged period of time. The classical trichogram is
values of the portion of anagen hairs for the different dia-
harmless to the patient and easy to use but not reliable.
gnosis and investigators with 95% confidence intervals of
AGA can be defined as an androgen-dependent process in
the means. The same is shown in Figure 10 for the length
genetically predisposed individuals, where balding is due
difference between anagen and telogen hairs.
to the continuous miniaturization of affected hair follicles,
The model of the portion of anagen hairs explains 96% of
changing large terminal HF into small vellus-like hairs [3,
the variance, the hair growth 85%. Both models are highly
18, 19]. Any successful treatment should therefore stop or
significant. Table II shows the model and the single
reverse the process of HF-miniaturization and increase the
effects. For both variables the diagnosis is highly signifi-
number of terminal HF whilst reducing vellus hair counts.
cant. These results show that an AGA-affected scalp
This concept is illustrated by the phase III studies of men
reveals a decreased number of anagen hair follicles
with AGA treated with finasteride [20]. In these studies
(Fig. 9), and these hair follicles grow more slowly
macrophotographs were taken and hairs were counted. This
(Fig. 10), compared to the hair follicles at the occiput.
technique produces counts of “visible” hairs, which meansthat tiny vellus-like hairs cannot be seen or counted. However, during treatment, these vellus-like HF get biggerand subsequently increase the hair count results when themacrophotograph method is used. A major disadvantage of
this technique is that it cannot monitor the expected conti-nuous increase in hair thickness during treatment. As a
consequence the phase III studies of men with AGA trea-ted with finasteride revealed that the increase in hair
counts reaches a plateau after one year of treatment, whe-
reas the hair coverage analyzed by global photographs
increased continuously [20]. This increase in hair coverage
is due to an increase in hair thickness as shown by histolo-
gical examination [3], the direct measurement of hair
thickness [21] and by the continuous increase in hair
weight [22]. Although the Ludwig pattern of AGA in
EJD n° 4, vol. 11, July-August 2001
Figures 9 and 10. While defining anagen hairs as growing and telogen hairs as non-growing hairs three days after shaving, theTrichoScan is able to calculate a digital trichogram. This figure illustrates the results (mean with 95% confidence interval) fromtwo investigators, who analysed of 18 volunteers with AGA the proportion of anagen hairs (Fig. 9) and the hair growth rate(Fig. 10) at the vertex and at the occiput (only 14 images). Compared to the occiput, the AGA-affected scalp reveals a decreasednumber of and slower growing anagen hairs. Both investigators produced similar results.
women differs in appearance [23] from the Hamilton pat-
by coloring the hairs prior to taking the images, without
tern occurring in men, these pathophysiological mecha-
any negative effect on the collected data. Furthermore, we
nims seem to be the same, because female AGA-patients
have created an entirely automatic software for the analysis
treated with cyproterone acetate [24-26] or minoxidil [27,
of the aforementioned parameters of hair growth. Because
28] experience an increase in hair thickness [24-26, 29] or
the described technique is a modified and computerized tri-
hair weight [27]. Therefore, a reliable hair counting
chogram we called it TrichoScan. The images were taken
method should primarily be able to calculate the number
with a video system for epiluminescence microscopy
and thickness of hairs, which is stable within at least 1cm
(ELM). ELM is a standard procedure for the analysis of
above the scalp [30, 31], in a defined area of the scalp.
melanocytic nevi [35-38], and many dermatologists in
From a clinical perspective the hair growth rate (mm/day)
Europe already use ELM-systems in daily clinical practice.
and the anagen/telogen ratio are of secondary importance.
These devices produce high quality and reproducible digital
As early as 1964 Barman et al. [32] related a method that
images, because the images are always taken at the same
used optical contact microscopy to calculate these parame-
distance of the lens to the skin surfaces. Our results suggest
ters, and much later Hayashi et al. [33] described a similar
that ELM-systems can be used for the evaluation of
approach for the measurement of hair growth by the use of
patients complaining from androgenetic effluvium and for
optical microscopy and computer analysis. However, these
authors were unable to automate the process of calculation
Variations that normally occur in hair length, weight,
and measured the thickness of hairs visually with the cursor
thickness, etc., can be assayed either with reference to
on the computer monitor. The authors calculated that the
standardized values, or by comparing measurements made
results from different investigators, but from the same image,
on two or more occasions over a given period of time.
differ by ± 8.4%, which makes such semiautomatic methods
Similar means of assay must be employed to study
as this unsuitable for clinical practice. A nearly similar
changes in hair growth which may occur with regard to
approach has been tested with the use of the phototrichogram
age or illness. The margin of error of the techniques and
(PT). The PT has proven to be a suitable and non-invasive
the instruments employed should be smaller than the
tool to monitor the hair growth phases in situ. This technique
magnitude of the variations to be measured. As our results
has been improved by the image analysis [12] and later with
show, the TrichoScan fulfils these criteria and has advan-
the use of immersion oil and digital contrast enhancement
tages over standard procedures used so far for hair measu-
[34]. However, although a marked improvement of the
rements. Firstly, it is investigator independent. In other
images and more accurate quantitative data were noted, [34]
studies using the unit area trichogram, a substantial diffe-
rence between the collected data from different investiga-
Until now the analysis of the images has been a tedious
tors was noted. In these studies a significantly larger mean
and time consuming process. Attempts to automate the pro-
total hair count was reported from experienced versus
cess have been performed several times unsuccessfully [33,
inexperienced observers [40]. Our results show, that this is
34, 39]. This is mainly because the HF on the scalp grow
not the case for the TrichoScan technique. Secondly, many
in groups (follicular units) rather than singly and therefore
methods are not strictly validated. The hair weight test is a
neighboring HF typically overlap or may be aligned in
good example where the hair is clipped in a defined target
parallel. Furthermore, any photographic analysis software
area. However, the sample error for different investigators
needs good contrast between the HF and the scalp skin to
is unknown. This is mainly due to the methodology itself,
be analyzed, and the fact that many hairs lose their natural
because once the hairs are clipped a second investigator
pigmentation due to aging or AGA, makes them much
cannot clip the same area again to assess the reproducibi-
more difficult to detect. We have overcome this difficulty
lity of the method. In contrast the TrichoScan is highly
EJD n° 4, vol. 11, July-August 2001
validated with defined values for intra-class correlation
9. Friedel J, Will F, Grosshans E. Phototrichogram: adaptation, standardi-
between the same and different investigators. This is of
zation and applications. Ann Dermatol Venereol 1989; 116: 629-36. 10. Guarrera M, Ciulla MP. A quantitative evaluation of hair loss: the
crucial importance for clinical studies. In cases where the
phototrichogramm. J Appl Cosmetol 1986; 4: 61-6.
expected differences between placebo and verum treated
11. Bouhanna P. The phototrichogram, a macrophotographic study of the
patients is known, the minimum number of patients neces-
scalp. Bioengineer Skin 1985; 3: 265. 12. Van Neste DJJ, Dumrotier M, De Coster W. Phototrichogram analysis:
sary to prove this difference can be calculated. Thirdly,
technical aspects and problems in relation with automated quantitative
some methods are associated with considerable discomfort
evaluation of hair growth by computer-assisted image analysis. In: Van
to the patient such as the repeated plucking of hairs requi-
Neste DJJ, Lachapelle JM, Antoine JL, eds. Trends in human hair growthand alopecia research. Dordrecht: Kluwer, 1989: 155-65.
red by the trichogram technique. The TrichoScan relies on
13. Van Neste DJJ, de Brouwer B, de Coster W. The phototrichogram: ana-
a small analyzed area of the scalp, which is afterwards
lysis of some technical factors of variation. Skin Pharmacol 1994; 7: 67-72.
barely visible. The tiny tattoo is the only discomfort
14. Rushton DH, de Brouwer B, de Coster W, van Neste DJ. Comparative
evaluation of scalp hair by phototrichogram and unit area trichogram
patients will notice. Fourthly, some methods to count hairs
analysis within the same subjects. Acta Derm Venereol 1993; 73: 150-3.
are tedious and time-consuming. By contrast, TrichoScan
15. Van Neste DJJ. Human scalp hair growth and loss evaluation methods:
can be performed by experienced hands within 8-12 min
is there simple and reliable method? Exp Dermatol 1999; 8: 299-301.
“hands on” experience. Fifthly, the number of items of
16. Hamilton JB. Patterned loss of hair in man: types and incidence. Ann NY Acad Sci 1951; 53: 708-28.
equipment necessary is small. Many dermatologists
17. Pecoraro V, Astore I, Barman JM. Growth rate and hair density of the
already have ELM-systems and these physicians would
human axilla: a comparative study of normal males and females and pre-
gnant and post-partum females. J Invest Dermatol 1971; 56: 362-5. 18. Hoffmann R, Happle R. Current understanding of androgenetic alopecia.
The primary advantage of this technique is that it can be
Part II: clinical aspects and treatment. Eur J Dermatol 2000; 10: 410-7.
used for clinical studies to compare placebo versus treat-
19. Hoffmann R, Happle R. Current understanding of androgenetic alope-
ment or to compare different capacities of different hair
cia. Part I: etiopathogenesis. Eur J Dermatol 2000; 10: 319-27. 20. Kaufman KD, Olsen EA, Whiting D, Savin R, DeVillez R, Bergfeld W,
growth promoting substances. This technique can be used
Price VH, van Neste DJJ, Roberts JL, Hordinsky M, Shapiro J, Binkowitz B,
for studying AGA or other forms of diffuse hair loss,
Gormley GJ. Finasteride in the treatment of men with androgenetic alope-
Moreover, it can be adopted to study the effect of drugs or
cia. Finasteride Male Pattern Hair Loss Study Group. J Am Acad Dermatol
laser treatment on hypertrichosis or hirsutism. ■
21. Steiner D, Bedin V, Pasello RR. Hair shaft diameter evaluation in AGA
before and after finasteride 1mg/day. Poster No. 284, Annual Meeting of22. Whiting DA. Advances in the treatment of male androgenetic alope-
cia. Eur J Dermatol 2001; 11: 332-4. 23. Ludwig E. Classification of the types of androgenetic alopecia (common
baldness) occurring in the female sex. Br J Dermatol 1977; 97: 247-54. 24. Peereboom-Wynia JD, van der Willigen AH, van Joost T, Stolz E. The
effect of cyproterone acetate on hair roots and hair shaft diameter in
androgenetic alopecia in females. Acta Derm Venereol 1989; 69: 395-8. 25. Dawber RPR. Haarwachstumsdiagnostik und das Haarwachstum stimu- 1. Barth JH, Rushton DH. Measurement of hair growth. In: Serud J,
lierende Substanzen. In: Tebbe B, Goerdt S, Orfanos CE, eds. Dermatolo-
Jemec GBE, eds. Non-invasive methods and the skin, vol. 1. Ann Arbor,
gie, heutiger Stand. Stuttgart: Georg Thieme Verlag, 1995: 243-8. 26. Mortimer CH, Rushton H, James KC. Effective medical treatment of 2. Headington JT. Transverse microscopic anatomy of the human scalp: a
common baldness in women. Clin Exp Dermatol 1984; 9: 342-50.
basis for a morphometric approach to disorders of the hair follicle. Arch27. Price VH, Menefee E. Quantitative estimation of hair growth. I. andro-
genetic alopecia in women: effect of minoxidil. J Invest Dermatol 1990;
3. Whiting DA, Waldstreicher J, Sanchez M, Kaufman KD. Measuring
reversal of hair miniaturization in androgenetic alopecia by follicular counts
28. Rushton DH. Management of hair loss in women. Dermatol Clin 1993;
in horizontal sections of serial scalp biopsies: results of finasteride 1 mg
treatment of men and postmenopausal women. J Invest Dermatol Symp Proc29. Vanderveen EE, Ellis CN, Kang S, Case P, Headington JT, Voorhees
JJ, Swanson NA. Topical minoxidil for hair regrowth. J Am Acad Dermatol4. Maguire HC, Kligman AM. Hair plucking as a diagnostic tool. J Invest 30. Jackson D, Church RE, Ebling FJ. Hair diameter in female baldness. Br 5. Blume-Peytavi U, Orfanos CE. Microscopy of the hair. In: Serud J, 31. Hutchinson PE, Thompson JR. The cross-sectional size and shape of
Jemec GBE, eds. Non-invasive methods and the skin, vol. 1. Ann Arbor,
human terminal scalp hair. Br J Dermatol 1997; 136: 159-65. 32. Barman JM, Pecoraro V, Astore I. Method, technic and computations 6. Rushton H, James KC, Mortimer CH. The unit area trichogram in the
in the study of the trophic state of human scalp hair. J Invest Dermatol
assessment of androgen-dependent alopecia. Br J Dermatol 1983; 109:
33. Hayashi S, Miyamoto I, Takeda K. Measurement of human hair 7. Canfield D. Photographic documentation of hair growth in androgenetic
growth by optical microscopy and image analysis. Br J Dermatol 1991;
alopecia. Dermatol Clin 1996; 14: 713-21. 8. Saitoh M, Uzuka M, Sakamoto M. Human hair cycle. J Invest Dermatol 34. Van Neste DJ, Dumrotier M, de Brouwer B, de Coster W. Scalp
immersion proxigraphy (SIP): an improved imaging technique for phototri-
chogram analysis. J Europ Acad Derm Venereol 1992; 1: 187-91. 35. Krischer J, Braun RP, Toutous-Trellu L, Saurat JH, Pechère M. Kaposi’s Abbreviations
sarcoma: a new approach of lesional follow-up using epiluminescent light
microscopy. Dermatology 1999; 198: 420-2. 36. Steiner A, Pehamberger H, Wolff K. Improvement of the diagnostic
accuracy in pigmented skin lesions by epiluminescent light microscopy. Anticancer Res 1987; 7: 433-4. 37. Braun-Falco O, Stolz W, Bilek P, Merkle T, Landthaler M. The derma-
toscope: a simplification of epiluminescent microscopy of pigmented skin
changes. Hautarzt 1990; 41: 131-6. 38. Kreusch J, Rassner G, Trahn C, Pietsch-Breitfeld B, Henke D, Selbmann Acknowledgements
HK. Epiluminescent microscopy: a score of morphological features to iden-
tify malignant melanoma. Pigment Cell Res 1992; (suppl. 2): 295-8.
The work of U. Ellwanger and H. Lüdtke (Datenanalyse und Ange-
39. Pelfini C, Calligaro A. Evaluation of hair growth by means of morpho-
wandte Informatik GbR [www.datinf.com], Brunnenstr. 14, 72074
metric computerized analysis. J Appl Cosmetol 1986; 4: 67-76.
Tübingen, Germany) in programming the software is greatly appre-
40. Rushton DH, Unger WP, Cotterill PC, Kingsley P, James KC. Quantita-
tive assessment of 2% topical minoxidil in the treatment of male pattern
baldness. Clin Exp Dermatol 1989; 14: 40-6. EJD n° 4, vol. 11, July-August 2001
A proposito di “ ALLEGRA…MENTE “ Desidero tirare le fila di otto laboratori estivi emblematicamente chiamati “Allegra…mente “ . Campi promossi e coordinati dal G.E.P. ( Gruppo Educhiamoci alla Pace ) di Bari dal 1997 al 2004, i primi quattro sono stati animati da risorse interne al Gep stesso . Di cosa sto parlando? Cercherò, non senza difficoltà, l’impresa ar
Association for Responsible Health Information and Advertising (ARHIA) 1. The Director General Department of Health; 2. The Registrar Medicines Control Council; Private Bag X828 PRETORIA 0001 23 October 2011 Dear Madame Director General, Dear Mrs Hela, Complementary Medicines: Regulations and Guidelines I am writing on behalf of the Association for Responsible Health I
 analyse the progression of AGA with and without treat-ment. All patients presented the clinical finding of mild tomoderate AGA with various degrees of involvement, thatwere classified according to the Hamilton scale [16] (II-V). Subjects with other forms of alopecia were excludedfrom the study. Twelve of 17 male patients with AGAwere treated with Propecia® (1 mg finasteride/day) for sixmonths. All patients actively treated had had no treatmentwhatsoever for hair loss at least one month before initia-ting this study. Eleven of fifty-six healthy male volunteers(age range 28-55 years, mean 36 years) who had experien-ced no episodes of hair thinning or hair loss, recent ill-nesses or general health disturbances, were recruited as acontrol group. Clinical examination revealed no evidenceof any hair disorder with either the female or the malevolunteers. The measured parameters were hair thicknessand hair numbers at the vertex.
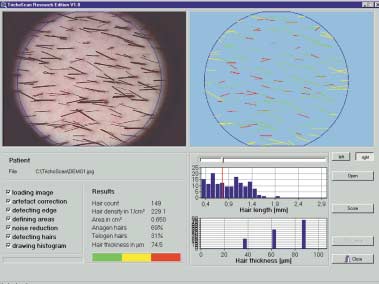 Figure 2. Example of theTrichoScan analysis ofhair number, hair density,cumulative hair thicknessand anagen/telogen ratio.
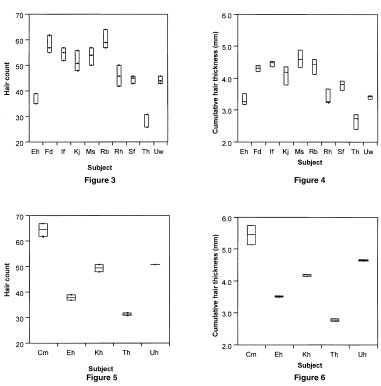 Figures 3-6. The intra-classcorrelation of three differentmeasurements in 10 volun-teers (subjects) from thesame investigator is shownfor hair counts (Fig. 3) andfor cumulative hair thick-ness (Fig. 4). The intra-class correlation of onemeasurement in 5 volunteers(subjects) from two differentinvestigators is shown forhair counts (Fig. 5) and forcumulative hair thickness(Fig. 6).
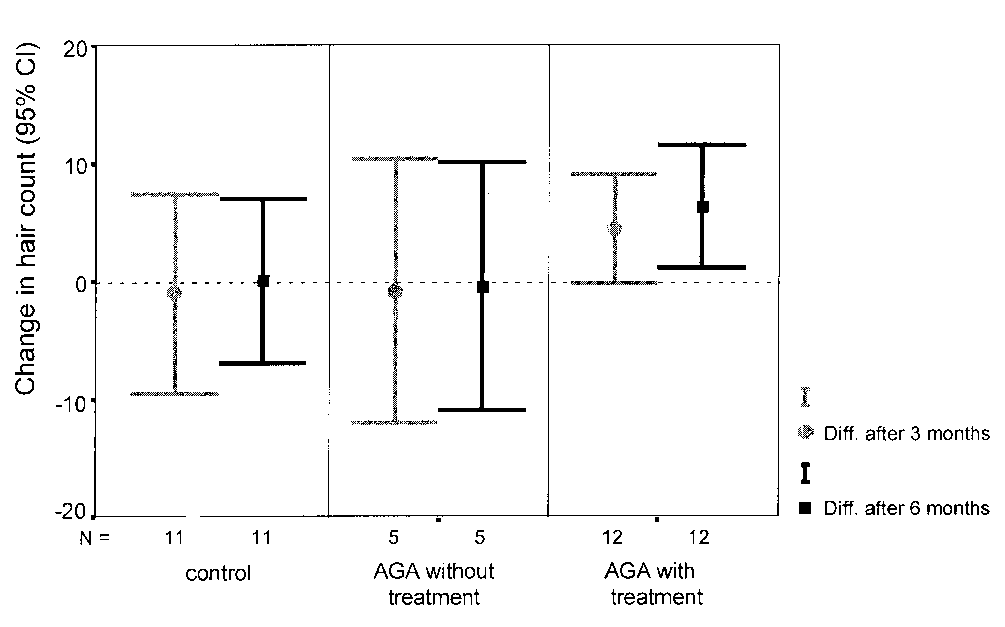
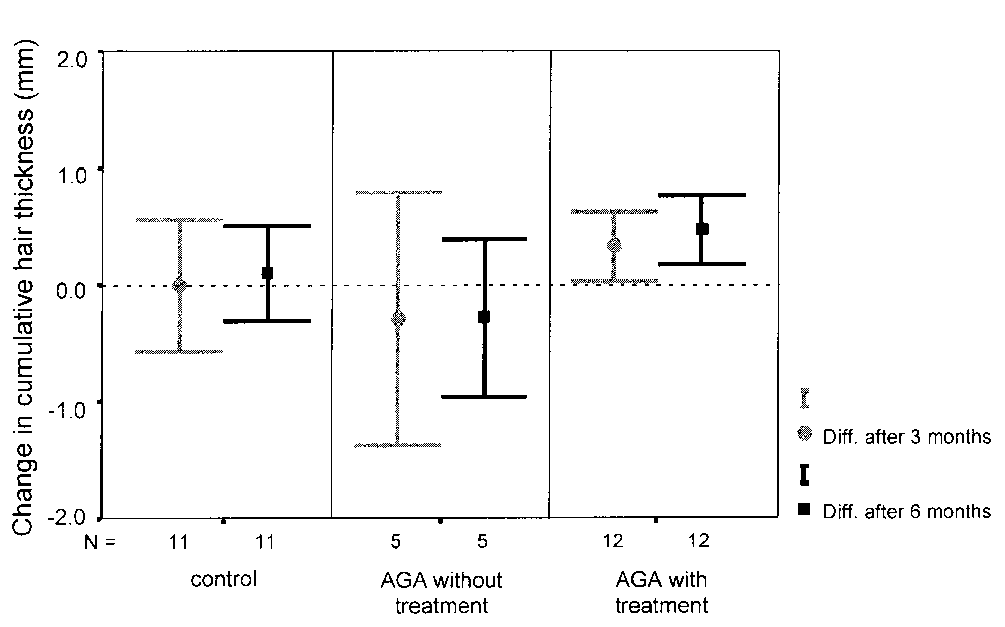 Figures 7 and 8. Hair counts and cumulative hair thickness were analysed for 6 months in 11 volunteers without AGA, in5 untreated men with AGA, and in 12 men treated with finasteride (1 mg/day). In controls and untreated men we noticed nosignificant difference in the number of hairs within the observation time of 6 months (between the values at baseline and after6 months). In contrast those men treated with finasteride showed a continuous increase (mean with 95% confidence interval) at3 months (p = 0.055) and at 6 months (p = 0.021) in the number of hairs within the analysed area compared to the values atbaseline. Untreated men showed a continuous and significant decrease in the overall thickness of hairs 3 and 6 months after theinitial visit (baseline). In contrast those men treated with finasteride showed, in comparison with the baseline visit, a continuousand significant increase in the number of hairs within the analysed area after 3 (p = 0.034) and 6 months (p = 0.006).
Analysis of anagen/telogen ratio and hair growth rate at
Discussion
Figures 7 and 8. Hair counts and cumulative hair thickness were analysed for 6 months in 11 volunteers without AGA, in5 untreated men with AGA, and in 12 men treated with finasteride (1 mg/day). In controls and untreated men we noticed nosignificant difference in the number of hairs within the observation time of 6 months (between the values at baseline and after6 months). In contrast those men treated with finasteride showed a continuous increase (mean with 95% confidence interval) at3 months (p = 0.055) and at 6 months (p = 0.021) in the number of hairs within the analysed area compared to the values atbaseline. Untreated men showed a continuous and significant decrease in the overall thickness of hairs 3 and 6 months after theinitial visit (baseline). In contrast those men treated with finasteride showed, in comparison with the baseline visit, a continuousand significant increase in the number of hairs within the analysed area after 3 (p = 0.034) and 6 months (p = 0.006).
Analysis of anagen/telogen ratio and hair growth rate at
Discussion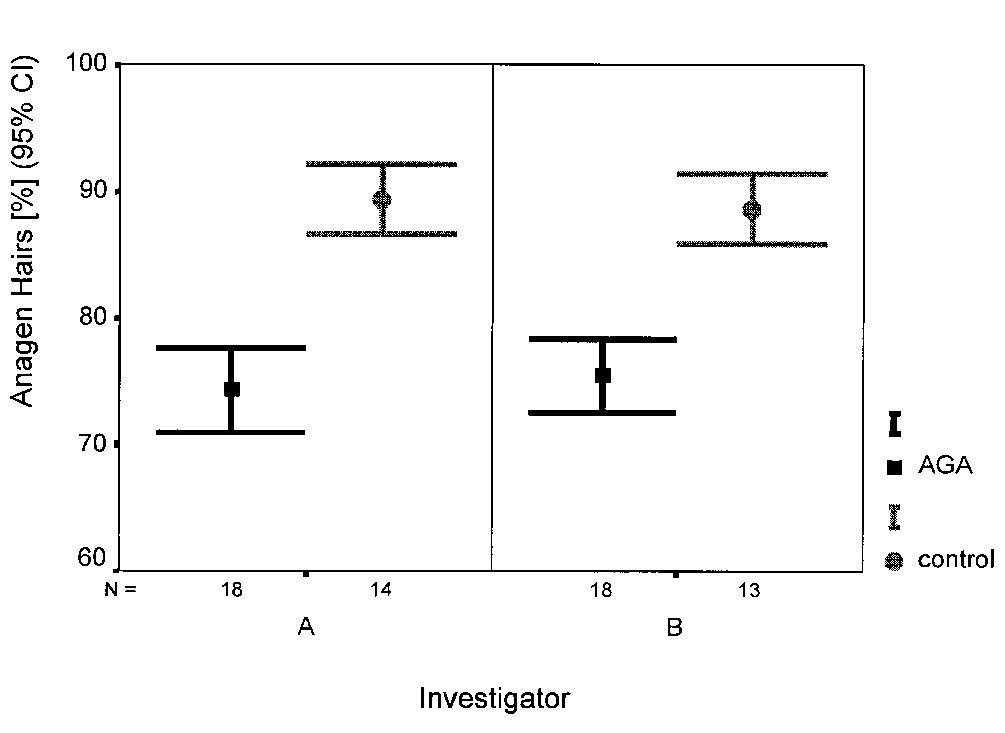
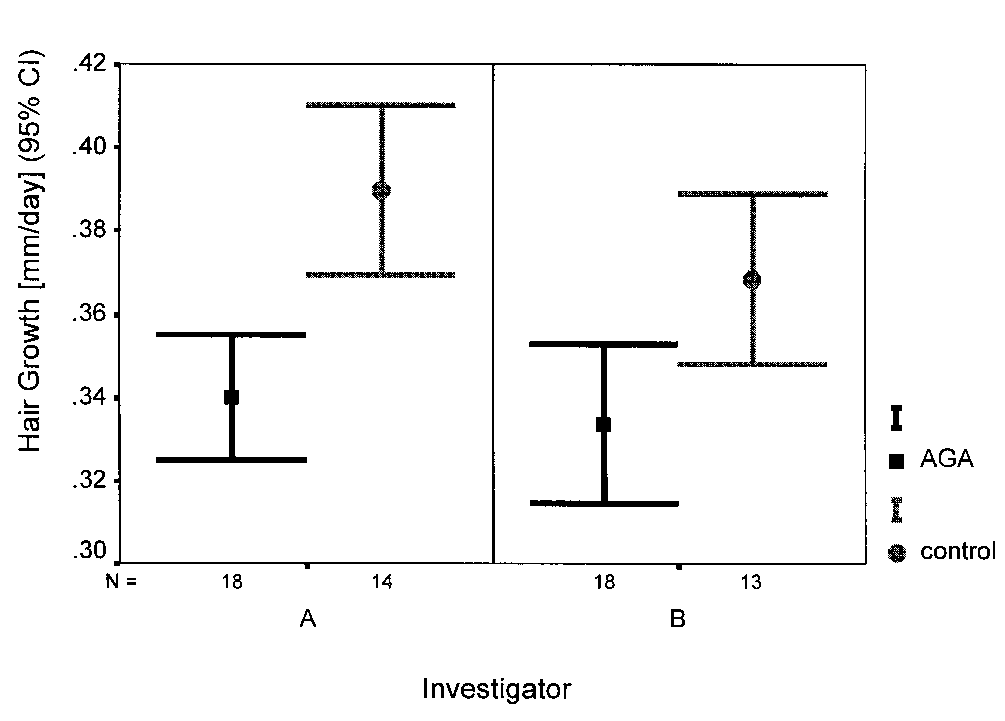 Figures 9 and 10. While defining anagen hairs as growing and telogen hairs as non-growing hairs three days after shaving, theTrichoScan is able to calculate a digital trichogram. This figure illustrates the results (mean with 95% confidence interval) fromtwo investigators, who analysed of 18 volunteers with AGA the proportion of anagen hairs (Fig. 9) and the hair growth rate(Fig. 10) at the vertex and at the occiput (only 14 images). Compared to the occiput, the AGA-affected scalp reveals a decreasednumber of and slower growing anagen hairs. Both investigators produced similar results.
women differs in appearance [23] from the Hamilton pat-
by coloring the hairs prior to taking the images, without
tern occurring in men, these pathophysiological mecha-
any negative effect on the collected data. Furthermore, we
nims seem to be the same, because female AGA-patients
have created an entirely automatic software for the analysis
treated with cyproterone acetate [24-26] or minoxidil [27,
of the aforementioned parameters of hair growth. Because
28] experience an increase in hair thickness [24-26, 29] or
the described technique is a modified and computerized tri-
hair weight [27]. Therefore, a reliable hair counting
chogram we called it TrichoScan. The images were taken
method should primarily be able to calculate the number
with a video system for epiluminescence microscopy
and thickness of hairs, which is stable within at least 1cm
(ELM). ELM is a standard procedure for the analysis of
above the scalp [30, 31], in a defined area of the scalp.
Figures 9 and 10. While defining anagen hairs as growing and telogen hairs as non-growing hairs three days after shaving, theTrichoScan is able to calculate a digital trichogram. This figure illustrates the results (mean with 95% confidence interval) fromtwo investigators, who analysed of 18 volunteers with AGA the proportion of anagen hairs (Fig. 9) and the hair growth rate(Fig. 10) at the vertex and at the occiput (only 14 images). Compared to the occiput, the AGA-affected scalp reveals a decreasednumber of and slower growing anagen hairs. Both investigators produced similar results.
women differs in appearance [23] from the Hamilton pat-
by coloring the hairs prior to taking the images, without
tern occurring in men, these pathophysiological mecha-
any negative effect on the collected data. Furthermore, we
nims seem to be the same, because female AGA-patients
have created an entirely automatic software for the analysis
treated with cyproterone acetate [24-26] or minoxidil [27,
of the aforementioned parameters of hair growth. Because
28] experience an increase in hair thickness [24-26, 29] or
the described technique is a modified and computerized tri-
hair weight [27]. Therefore, a reliable hair counting
chogram we called it TrichoScan. The images were taken
method should primarily be able to calculate the number
with a video system for epiluminescence microscopy
and thickness of hairs, which is stable within at least 1cm
(ELM). ELM is a standard procedure for the analysis of
above the scalp [30, 31], in a defined area of the scalp.