Original Article Data transformations and representations for computation and visualization Abstract
At the core of successful visual analytics systems are computational
techniques that transform data into concise, human comprehensible visualrepresentations. The general process often requires multiple transformation
steps before a final visual representation is generated. This article characterizes
the complex raw data to be analyzed and then describes two different sets oftransformations and representations. The first set transforms the raw data into
more concise representations that improve the performance of sophisticatedcomputational methods. The second transforms internal representations into
aThe Boeing Company, PO Box 3707, Seattle,
visual representations that provide the most benefit to an interactive user. The
end result is a computing system that enhances an end user's analytic process
with effective visual representations and interactive techniques. While progress
has been made on improving data transformations and representations, there
cGeorgia, Institute of Technology, Atlanta,
is substantial room for improvement. Information Visualization (2009) 8, Keywords: algorithms;
visual metaphors; data characteristics; visual
Introduction
Visual analytics systems must integrate a number of different computingcapabilities. In many ways, a visual analytics system is similar to othercomplex systems that people use daily. When abstracted, systems have
user interface, algorithmic and data components. When dissected morecompletely, systems differ in terms of the tasks that a user must perform totransform data into more meaningful forms.
Because of certain data characteristics, a wide range of algorithmic
approaches are needed to transform the raw data into increasingly conciserepresentations that are then transformed into visual representations thatusers examine to obtain insight.
This article examines specific types of raw data and the types of computa-
tional and visualization transformations and representations that improve
a user’s analytic ability. There are two different types of transformations and
representations. The first is used to identify higher-order characteristics in
Workshop attendees included representatives
the data, such as relationships, trends, summaries, clusters and synopses.
from the visual analytics research communityacross government, industry and academia.
The second is responsible for transforming data into the visual represen-
The goal of the workshop, and the resulting
tations that help the user navigate the overall data space. Both types of
article, was to reflect on the first 5 years of
transformations and representations must cope with scale and complexity.
the visual analytics enterprise and proposeresearch challenges for the next 5 years. The article incorporates input from work-shop attendees as well as from its authors. Raw Data Characteristics
Computers store, move and analyze data that, on initial examination, are
a simple collection of bits. Collections of bits are organized into different
units (files, directories, databases, network packets and so on). Information Visualization Vol. 8, 4, 275 – 285
These collections of bits form primitive data types1
evolution of value changes is often important. Examples
that include text, numbers, still images, audio and
video. Combinations of primitive data forms canbe:
• A snapshot of a given data set (for example, a large set of
documents) freezes geo-location and time at a specific
• Structured (for example, relational tables, geometry).
Often contains numeric values. Some fields may contain
A series of snapshots (for example, transaction-based
relatively small amounts of free-form text.
systems, the web) that evolves over time.
Semi-structured (for example, e-mail that contains
Streaming data (for example, real-time sensors, network
header data, attachments and text; network packets
data) are collected continuously, which increases data
headers and payloads; scientific data resulting from
Geospatial data gives an analyst critical understanding
Unstructured (for example, a collection of text).
of the physical location of specific event occurrences. When coupled with temporal data, significant patterns of
Many of the challenges1, especially in dealing with
activity may emerge using implicit methods (for example,
textual data, still exist. This article examines a number
kernel methods) and explicit methods (for example,
of algorithmic approaches organized around key data
feature combinations, supervised learning).
characteristics. The characteristics apply to all primitive
Imperfect data. The data, regardless of volume, often
data forms rather than algorithms that apply to specific
contain noisy, missing, erroneous, incomplete or deliber-
data types. The article adds the notion of inserting a
ately misleading values. Text data are particularly difficult.
user-in-the-algorithmic-loop to help guide the raw data
The values in a given text field or document range from
transformation process. In addition, it introduces a set of
cleanly edited to quick-and-dirty entries. Shorthand and
transformations needed to produce effective visual repre-
abbreviations are often present, especially in data that are
sentations. Transforming data into an effective visual
pertinent to a specific domain. For example, consider the
representation is fundamentally different from trans-
variation in language among medical records, airplane
incident reports and cell phone text messages. Different
When defining approaches for data transformations
natural languages pose a problem because text can be
and representations, algorithm designers must consider
entered carelessly or erroneously by either native or non-
that visual analytics systems are interactive in nature,
native speakers. Analysts often gain insight from data
which makes algorithms that are sufficiently fast enough
anomalies, and the analyst is responsible for determining
to interactive performance critical. Interactive users
whether the unusual data are informative or extraneous.
expect a response for a simple task in a few seconds or less
A significant amount of work is needed in this area,
and are more patient when they realize that the computer
although some techniques, such as those based on vector
is performing a complex computation. Even so, tasks that
take more than a few minutes can lead to user frustration
Heterogeneous data. Analysts must often gain significant
insight from multiple data sources. In some cases, inte-
grating the schemas may be possible. Even if schema
interactive analytics, characteristics of the data itself affect
integration is possible, multiple data sources increase
the transformations and representations for both compu-
the raw data volume and increase the probability that
tation and visualization. The key characteristics are:
specific fields or values will have conflicting mean-ings. Furthermore, the methods needed to assemble
Massive data. The amount of data that may be perti-
the data in a heterogeneous data environment gener-
nent to a specific analysis task is potentially unlimited.
ally differ from one another on a data store-by-data
Even though the vast majority of data may be triv-
store basis. Extracting, translating and loading (ETL) the
ially rejected, the data volume can easily range from
data into the visual analytics system may take longer
megabytes to petabytes. Some analysts must make
than the analysis itself. The long duration for ETL may
decisions based on a relatively small amount of data
even cause currency problems with the data and nega-
(for example, a safety engineer looking at commer-
tively affect temporal trend analyses. Two promising
cial aircraft incident reports), while others require
approaches are to use a joint probabilistic model for
terabytes (for example, an administrator looking at event
different attributes and to carefully build a dissimilarity
logs for network intrusions). Massive data sets must
often be transformed into a smaller number of dimen-
User-in-the-loop. The data transformations and represen-
sions or aggregated to allow users to cope with the
tations that apply to basic analysis tasks are different
from those that produce a visual display. In addition,
Geospatial and temporal data. Significant amounts of data
data volume differs from visual volume. For example,
have location and temporal dependencies. Both geospatial
consider a set of data that captures network traffic. The
and temporal data are dynamic, and understanding the
transformations and representations that produce various
Information Visualization Vol. 8, 4, 275 – 285 Figure 1:
summaries are fundamentally different from those that
The need for scalable data representation and transforma-
produce images of the network traffic.
tion methods forces the development of new paradigmsthat will enable major improvements in decision-making
The visuals themselves can vary significantly as shown
processes through better methods for understanding and
in Figure 1. The image on the left offers a visual tech-
predicting outcomes in complex situations and scenarios.
nique to show relationships between specific values in
Achieving interactive performance adds further comple-
a large table. The image on the right uses a traditional
xity. Complex operations on large data sets today often
histogram to show the numeric order of specific fields in
require minutes and even hours to perform. Long response
a relational table. Different transformations produced the
times COPY
render such operations ineffective in highly interac-
tive environments. Furthermore, data sets are becoming
Adding a user-in-the-loop can help direct the analysis
more massive and complex over time, necessitating devel-
when the user has specific domain knowledge. Because of
opment of scalable algorithms that are implementable on
the breadth of visual analytics applicability, determining
generalized methods for data and visual transformations
Massiveness of data also refers to its high dimension-
and representations is challenging. Domain knowledge
ality. While humans are excellent at finding patterns in a
often leads to simplifying assumptions and customiza-
2D- or 3D space, they have difficulty processing massive
tions that improve both computational and visualization
amounts of data in higher dimensions. Dimension reduc-
transformation accuracy and performance.
tion generally is achieved through feature extractionthat creates new coordinate spaces through linear andnonlinear transformations or feature selection that iden-
Transforming and Repr esenting Data for
tifies an important subset of features from the original
Computation
high-dimensional data set. Dimension reduction is oftenused to improve efficiency in computational cost and
storage complexity, noise reduction, or noise removal.
methods combine mathematical, statistical and linguistic
It can produce improved accuracy and is essential for
analysis with hardware and software techniques to handle
2D and 3D visualization of data. Dimension reduction
massive data, geospatial and temporal data, imperfect
methods may differ when applied to visual analytics
data, heterogeneous data, and users-in-the-loop. The
combination poses significant research challenges. This
For data sets for which there is no a priori knowledge,
section discusses approaches and shortcomings in those
dimension reduction methods such as Principal Compo-
approaches that require additional work.
nent Analysis (PCA)3 and Latent Semantic Indexing (LSI)4provide theoretically well-justified projections of high-
Massive data
dimensional data onto lower-dimensional spaces. BothPCA and LSI are based on the Singular Value Decompo-
A major challenge arises from the sheer volume of data.2
sition (SVD).5 SVD, on which many methods are based,
The size and complexity of the data sets appearing
is a powerful mathematical tool in understanding the
now and in the future are an impediment to the full
space spanned by the data represented in a vector space.
exploitation of visual analytics. This section focuses on
It provides a method to capture the rank, orthonormal
the computational and algorithmic methods needed to
bases and characteristics of the noise space associated
distill information from ever-expanding data streams.
with the space spanned by the data. SVD has been used
Information Visualization Vol. 8, 4, 275 – 285
extensively in numerous science and engineering prob-
data are discarded. The applicability of feature selec-
lems, including signal, image and text processing. When
tion as a dimension reduction technique has not been
additional information concerning characteristics of the
extensively explored in visual analytics. Promising new
data such as its cluster structure or the fact that data
methods can be expected to arise from the development
values are always non-negative is available, dimension
of a comprehensive theory of automatic feature selec-
reduction methods that reveal this fact can achieve better
tion by sparse recovery. Such methods combine concepts
results. Two examples are Linear Discriminant Analy-
from learning theory and can yield insights into new
sis (LDA)6 for clustered data and non-negative matrix
algorithms (for example, boosting, kernel machines).
factorization7,8 for non-negative data. If the inter-data
One example where the data sets are represented in
relationship is not linear, nonlinear extensions such as
high-dimensional space is text. Text documents are orig-
Kernel PCA and Kernelized Discriminant Analysis may be
inally represented as a sequence of words over a finite
vocabulary V. This representation is problematic because
To reveal nonlinear structure in the data, many
documents of different lengths cannot be easily compared
promising methods such as manifold learning have been
to one another. Instead, the first step in text analysis is
developed. In manifold learning, the goal is to find a
to convert the documents into numeric vectors of fixed
lower-dimensional (typically nonlinear) representation
dimensionality. One option, leading to vector representa-
of the data given in a high-dimensional space. A rich
tion of dimensionality |V|, is to construct vectors whose
literature exists in this area, and the most widely used
components are the relative word frequency or normal-
methods include multi-dimensional scaling ISOMAP,
ized word counts in the document. A slight variation
locally linear embedding, Laplacian eigenmap, and local
represents a document as a binary vector of dimension-
tangent space alignment. Typically, in these manifold
ality |V| whose components represent presence or absence
learning methods, the dimension-reducing nonlinear
of words. Higher-dimensional representations may be
transformations are not explicitly available. In other
constructed by keeping track of appearances of short
linear and nonlinear dimension-reducing transforma-
tions such as PCA, LDA and their kernel counterparts,
Promising new methods can be expected to arise
transformations are explicitly computed and therefore
from the development of a fundamental comprehensive
make representation of unseen data points in the same
theory COPY
of automatic feature selection by sparse recovery.
lower-dimensional space possible. Development of an
Such methods link together many ideas from learning
effective and general asymptotic theory for manifold
theory and can yield insights into new algorithms such
learning in terms of differential operators on manifolds
can yield new algorithms for nonlinear dimension reduc-
Many powerful new algorithms for dimension reduc-
tion and address many practical questions.
tion pose even more difficult optimization problems than
To make linear and nonlinear dimension reduction
arise in current methods, leading to the need to solve
methods more effective in handling massive data, the
very large-scale, semi-definite programming problems.
basic characteristics of the dimension reduction methods
Recent research has focused on the design of dimension-
for 2D or 3D representation of high-dimensional data
reduction methods that incorporate interpretability
sets must be understood. In many dimension reduction
constraints such as sparsity and non-negativity. The
methods, the optimal reduced AUTHOR
resulting algorithms increase one’s understanding of
smallest acceptable reduced dimension with respect to
the transformations and further facilitate visual repre-
the specific criterion of a dimension reduction method,
sentation of very high-dimension data. In addition,
is either unknown or much larger than 2 or 3. One may
incorporating expert opinion and necessary constraints
simply choose the leading two or three dimensions, but
in the problem formulation of dimension reduction is
this may result in loss of information. This loss hinders
expected to produce more insightful representations of
understanding because the true characteristics of the
data sets (for example, cluster structure, relationships, oranomalies) are hidden. Substantial research effort needsto be made for progress in this direction, although there
Geospatial and temporal data
Feature selection is another way to achieve dimension
Complex geospatial and temporal data provide a wealth of
reduction. Unlike feature extraction, feature selection
information on complex phenomena that varies over time
specifically selects a small number of relevant features.
and/or place. Such data streams are called spatio-temporal
Feature selection algorithms typically perform feature
multi-dimensional data (STMD). Geospatial and temporal
ranking or subset selection. Feature ranking methods
data include dynamically changing location and/or time
determine relevant features by a certain scoring metric
stamps as part of its metadata. STMD can be readily found
and can be computationally expensive when the data
in many real-world critical sources today, including
dimension is very high. When feature selection is used toderive a 2D or 3D representation of the data, the results
may not convey much information because too much
Information Visualization Vol. 8, 4, 275 – 285
• human-activity logs that are becoming increasingly
generalization performance if the dimensionality of the
• less formal digital socializing (for example, web logs, RSS
Another example of an explicit STMD transformation14
builds a graph-based data representation15, which consi-ders a given data set as a bipartite graph. This approach
These applications and others like them reveal complex,
increases the performance of supervised learning algo-
time-series data that must be manually monitored for
rithms while leaving the data space’s dimensionality
near real-time analytic results. It is possible to apply tradi-
unchanged. The latter aspect mitigates the exponential
tional algorithms to these data, but doing so typically
growth in dimensionality inherent in feature combina-
pushes analytic results beyond near real-time applica-
tion approaches. Vertices of one partition of the graph
tion. Near real-time results can be accomplished through
correspond to data instances. Vertices of the other parti-
techniques such as sampling and aggregation. Such
tion correspond to features. Two vertices u and v are
techniques often remove or further mask the impor-
connected by an edge (u,v) if feature v has non-zero
tant underlying semantic information analysts seek to
value in instance u. Unlike approaches that assume
discover. New computational transformations are needed
data instances are independent, this approach leverages
to leverage such data in a near real-time visual analytics
higher-order co-occurrence relations between feature
values across different instances and enables virtually any
Kernel methods10 have been applied as an implicit
learning method to take advantage of this rich connec-
data transformation for STMD. A kernel function can be
tivity. Developing an unsupervised analogue will add
viewed as an implicit (nonlinear) mapping of data objects
from the original input space to a high-dimensionalfeature space. The application of learning methods subse-quently takes place in this feature space. The strength
Imperfect data
of kernel methods lies in their ability to expose hiddendependencies between input features relevant to the
Effectiveness and accuracy of a solution should not be
learning task. This in turn leads to simplification of
compromised in the name of achieving high efficiency
the problem and improved performance of simple (for
whether dealing with massive or small volumes of data.
example, hyperplane-based) learning methods. However,
The fact that most real-life data sets are noisy, corrupt
applying a kernel-based data transformation causes latent
and have missing values presents a challenge. In some
relationships among input features to be distributed
cases, data may have been tampered with to be deliber-
over a (sometimes infinite) number of dimensions of
ately misleading. In addition, measures of accuracy are
the feature space. A kernel only allows the computation
not always known because of the high complexity of the
of a certain aggregate quantity (the scalar product) in
solution process in visual analytics.
the feature space. Therefore, it is not possible to analyze
Methods for representing the noise level in data may
the relations exposed by the kernel mapping between
guide the analyst to ensure proper utilization of noisy
input features. Even though a variety of kernel functions
data. Ideally, methods for noise reduction and noise
have been developed, these methods are only appro-
removal can be applied. However, extreme caution must
be taken because many existing practices are rather
between objects can be estimated as some average of
heuristic and often lack theoretical justification. Manu-
(dis)similarities across all features. Finally, kernel methods
ally entered data, in contrast to physical data that comes
are critically dependent on domain experts for construc-
from sensors, radio frequency identification devices, and
tion of appropriate kernel functions. Extending kernel
the like, contain noise characteristics that cannot be well
methods to overcome their shortcomings as applied to
STMD is a significant research challenge.
An even more difficult situation arises when the data
In contrast to implicit STMD transformations, explicit
set contains completely missing components. Many
transformation approaches can explicitly access the
analysis algorithms assume complete knowledge of the
feature space and apply visualization and learning
data points. Use of such algorithms in the presence of
missing values requires imputation methods. Effective
Mining12) that cannot be formulated in terms of vector
information representation often comes from mathe-
matical modeling of the problem and is constrained
Explicit transformations can be applied to other prob-
and driven by interactive visualization and analytical
lematic data forms because explicit data transformations
allow increased expressivity of features. One popular
The choice of representation of noisy data should be
example is feature combination, which may be used
guided by close collaboration with domain experts and
for expansion of the base set of features in natural
an understanding of the users’ needs so that they can
language.13 This work demonstrated that such feature
be formulated in the model. Often these turn into large
spaces allow for robust learning, whereas implicit kernel
scale constrained optimization, matrix computation and
expansion of the feature space may lead to degradation in
graph theoretic problems. Robust algorithms that produce
Information Visualization Vol. 8, 4, 275 – 285
solutions that are insensitive to perturbations in input or
• A combination of quantitative and qualitative infor-
conditions are needed, as are stable algorithms that reli-
mation. This is the case when quantitative physical
measurements are combined with qualitative human
Another important challenge arises when there is the
judgment that takes the form of text.
possibility of intentional disinformation or deception. In
• Attributes from multiple, merged databases. Joining
this case, the transformation and subsequent visualiza-
databases for analysis is a difficult task that becomes
tion should reflect the provenance and trustworthiness
even harder when similar attributes have different
of the data. Data provenance16 refers to the origin of
the data and its movement and transformation from thepoint of origin to the visualization system. Source trust-
Heterogeneity causes substantial difficulties in devel-
worthiness refers to the probability that the information
oping data transformation and dimensionality reduction
source includes disinformation. Data trustworthiness
techniques. Many techniques assume, either implicitly or
refers to the probability that the received information was
explicitly, that the attributes are normally distributed. For
subjected to deception somewhere along the provenance
example, PCA implicitly assumes a normal distribution
because it is based on maximum likelihood estimation
The trustworthiness of the source may be determined
applied to a normal distribution. A similar observation
from historical data or human judgment. The trustwor-
applies to the k-means and Gaussian mixture clustering
thiness of the received data may be computed from the
models. It is not immediately clear why the normal distri-
provenance path and the trustworthiness of the sources
bution is an appropriate assumption in cases of heteroge-
neous data. It is certainly a questionable assumption for
There are some similarities between imperfect or noisy
data and deception. In the former, noisy data may be
A promising direction for deriving transformations
removed or modified before selecting the computational
for heterogeneous data is to first obtain a joint proba-
and visualization transformations. In the latter, the poten-
bilistic model for the heterogeneous attributes. Proba-
tial for deception and the trustworthiness of the different
bilistic models for heterogeneous data include loglinear
information sources are important factors that need to be
models and undirected graphical models17,18
considered. The suspected data may be removed or modi-
Bayesian networks.19 Once the model parameters are
fied before deriving the optimal transformation. However,
estimated using a technique like maximum likelihood, an
the data, their provenance, and trustworthiness need to
appropriate transformation may be obtained by consid-
be transformed and visualized along with the more reli-
ering the model parameters. This approach can also be
used to extend standard methods such as PCA. Exam-
For anomaly cleaning and detection, formulations
ples include probabilistic PCA and exponential family
based on various vector norms, especially the L1 norm,
can be extended to achieve practical robust methods.
An alternative approach is to forgo the modeling process
Extensions to streaming, dynamic data and specific data
and to rely instead on a carefully constructed distance
types (for example, text, images) and data of mixed
or dissimilarity measure. Such a measure may be used
type need to be considered. Transforming imperfect data
to derive an appropriate transformation in conjunction
remains a continuing challenge AUTHOR
with multi-dimensional scaling.20 Avoiding the need to
robust results for visual analytics.
construct a model for heterogeneous data and obtain themaximum likelihood parameters is a substantial advan-tage. A disadvantage is that the quality of the obtained
Heterogeneous data
transformation is in direct relation to the quality of thedistance or dissimilarity measure. Constructing a sensible
Heterogeneous data occur in a number of different forms,
distance or dissimilarity for heterogeneous data may be
a very challenging task. The use of domain knowledge orinteractive feedback is likely to play a key role in designing
• Nominal attributes that possess different sets of possible
effective distance or dissimilarity measures for heteroge-
values. For example, medical records contain attributes
neous data in visual analytics systems.
with substantially different ranges of values.
• A combination of numeric and nominal values.
For example, medical records may contain numeric
User-in-the-loop
attributes such as weight, height and age, along withnominal attributes such as ethnicity, symptom appear-
The goal of a visual analytics system is not to perform
analysis automatically but to facilitate it. A user-in-the-
• Multiple attributes possessing different noise character-
loop is therefore a central and critical element of visual
istics. For example, sensor network observations form
analytics systems and must be in constant consideration
a vector of measurements, where each component has
throughout the design and implementation of such a
Information Visualization Vol. 8, 4, 275 – 285
All of the above techniques take on an additional
first published in 1955.22 The best clustering approach is
burden when placed in the context of a person. Humans
often very closely tied to the end goals of the intended
have limited faculties (physical, mental and otherwise)
users. For example, the task of binary clustering of a collec-
that must be addressed by viable solutions if they are to
tion of animals may produce two completely different
be used in the context of visual analytics. For example,
groups, such as mammals versus birds or predators versus
while the winner of the InfoVis 2003 Contest21 could
non-predators, depending on the features used to repre-
computationally compare two trees of 100 000 elements
each, it also provided several interface methods to support
In visual analytics, experts can often provide addi-
a human’s understanding and navigation. Data with
tional information. This can be realized by designing
high-order dimensionality must be reduced to two or
clustering methods that use human-specified constraints.
three dimensions just to be displayed without losing key
Semi-supervised clustering formulates the problem in
information after dimension reduction is performed.
a way to satisfy cannot-link and must-link constraints.
People add a social dimension to visual analytics. Many
Methods that can incorporate additional expert input
organizations that perform large-scale analysis work in
as constraints in the clustering problem formulation
teams that may or may not be co-located. Some organi-
will provide more accurate representations of data. New
zations may address distributed analysis over an organi-
approaches such as those based on multi-resolution data
zational private network. Still other organizations, such
approximation for scalable data transformation opera-
as governmental agencies and public safety departments,
tions using hierarchical data structures and multipole-like
require alternative solutions because of the geographical,
expansions provide promising directions.
legal and cultural boundaries that collaborative analyst
The user-in-the-loop dimension of visual analytics
sessions regularly cross. Therefore, there is a research need
is being extensively studied in the later phases of the
for systems that will facilitate multi-user collaborative
analytical process. ‘Sensemaking’ systems and methods
distributed analysis safely, securely and legally.
assist users in managing and making sense of their
Users must be able to trust visual analytics results.
data.23,24 Enhanced visualization techniques25–27 are
In line with the above comments regarding misleading
being developed to display and navigate through the
data, ‘trust’ in this sense refers to the user’s faith that the
complex, dynamic and temporal data prevalent today.
analytics system is transforming data in ways that main-
However, all of these techniques and systems involve
tain the original data’s characteristics while foregoing
the user interactively only when the data have been
adding artificial biases. Establishing and maintaining this
collected and transformed into their (final) analytical
trust is especially important for analysts who may be
representation. The possibility of including the user in
called to explain their analytical process to another deci-
the intermediate transformation and representation steps
sion maker (for example, a chief scientist, a lawmaker, a
is an interesting one. The effect of this compared to fully
automated approaches and the effect of this interaction
Users are dynamic and constantly change through anal-
on the analytical process are all open areas of research.
ysis: their mental context, their model of the analyzed
Recognizing and leveraging user dynamism provides
phenomenon and their focus or trust in various regions
significant benefit when done correctly. User modeling
of data will often change through the course of analysis.
research28,29 is still exploring strong guidelines for devel-
oping and maintaining an accurate model. With such
of evidence, a new website discovered or a new laboratory
a model, systems can adapt to the user’s context and
result can quickly bring a new perspective on the current
the machine’s processing capability.30,31 Systems could
also use such modeling techniques to capture the user’s
There are also physical constraints imposed by limited
mental state in the analytical process32 and provide
screen space with only two or three display dimensions.
support for following best analytical practices. Integrating
Limitations in human cognition capacity to communi-
user modeling with visual analytics systems is still in its
cate high-volume and high-dimensional data also present
important challenges. Even with today’s growing displaysize and resolution and the use of multiple monitors,display walls and CAVEs, the number of available pixels
Challenge synopsis
remains a fundamental limiting factor. The small screenson mobile devices used by first responders exacerbate the
Challenges in data transformations and representations
Methods for judiciously approximating or down-
weighting large regions as appropriate to the analysis of
• Maintaining transformation performance to sustain
interest will provide solutions to some of these demands.
interactive rates, even when handling huge volumes of
Clustering can provide a simple starting point toward
organizing data into related groups for improved under-
• Because the same item may be interpreted differently
standing and learning. Numerous clustering methods
across heterogeneous data stores, reconciling semantic
have been developed since the k-means algorithm was
Information Visualization Vol. 8, 4, 275 – 285
• Uncertainty is caused by a number of different data
effective analytic environments, visual metaphors are
characteristics. Estimating this uncertainty and commu-
needed for different data representations, including
nicating it in a meaningful way is an important chal-lenge. Deriving value when the quality of the data varies
significantly. For example, human language differences
• data signatures and transformed data;
change the meaning of words in text, video and audio;
• metadata information including related data, transfor-
noise in sensors affects numeric data.
mations and algorithms applied to generate the data
• Developing provenance and context of data source(s)
signatures, as well as data lineage.
• Computing with data in situ to minimize the impact of
To be effective, these visual representations must accom-
modate the users’ perceptual preferences and characteris-
• Transforming information into knowledge.
tics (for example, color acuity, form dominance) and their
• Keeping the user clearly involved in the analytic loop
cognitive analysis style, the characteristics of the display
to not only provide the results from various types of
device (for example, cell phone versus display wall), and
transformations but to also allow the user to guide the
the characteristics of the task they are performing (for
example, time frame for decision making, discovery task,analysis task, verification task, situational awareness task). The key issues are centered on developing principles and
Transformations and Representations for
techniques to enable cognition amplification.33 Creating
Visualization
useful and appropriate cognitive artifacts enhances bothreflective and experiential cognition.33 The design task
The first two sections described the raw data character-
must use cognitive principles such as the appropriate-
istics and the methods to transform the data to efficient
ness principle the naturalness principle and the matching
representations. The final step, described in this section,
is to develop visual representations of the transformeddata that gives the end user an easy-to-analyze visualform. Human adapted display of data to enhance analysis -- The balance between automated data processing and human reasoning From data to visual display
Each data type (raw data, appropriately transformed
The overall goal of creating visual representations is to
data – using techniques from the previous section –
use cognitive and perceptual principles that increase
and metadata) offers the challenge of determining an
the communication impact of the results of the data
effective visual representation. Decision making is the
transformation process to enable visual analysis and
ultimate goal. The decision-making environment must
knowledge synthesis. These techniques need to use visual
allow visual cognition and analysis in a way that lets the
representations that ease the user’s cognitive burden
user guide additional data analysis and transformation to
through the creation of effective AUTHOR
complete the task at hand. Over the past 10 years, this has
facts, work across problems and data at multiple scales,
become an active area of research, but many challenges
and semi-automatically adapt to the task at hand. There-
fore, a clear understanding of the principles of effective
There have been some good systems that use data char-
visual information depiction is needed.
acteristics to determine appropriate visual mappings.33
Incorporating these principles into visual analytics
These are often based on low-level perceptual character-
systems allows the creation of appropriate visual repre-
istic mappings for the classes of data (for example, ordinal,
sentations. The level of abstraction and choice of visual
nominal, interval, ratio). Over the past several years, these
representation are keys to success. The goal is to not
techniques have begun appearing in commercial prod-
only present the deluge of data that the analyst receives
ucts to aid users in understanding their data (for example,
but also extract the relevant information from these
ShowMe in Tableau35). Several systems match task and
data in a format that enables reasoning and analysis.
data characteristics to appropriate visualizations36,37 and
Therefore, improved visual representation can be gener-
there is new work in evaluations of their effectiveness.38
ated that incorporates both advanced techniques for
Numerous systems provide abstract, illustrative render-
showing complex 3D structures. In addition, techniques
ings of data by attempting to harness the power and
are needed for abstracting the representation, focusing
conciseness of the representations developed by medical
the user’s attention and providing contextual informa-
and technical illustrators.39–41 A number of efforts have
tion for reference. All of these techniques must adapt to
been made to use design principles for visualization
the large variety of types and kinds of information to
over the past 10 years.42 All of these approaches have
be simultaneously analyzed and scaled across both data
been used on a limited basis and represent only initial
size and display size (PDA to wall display). In creating
steps at solving the problems of creating the most
Information Visualization Vol. 8, 4, 275 – 285
effective visual representation for multi-source, multi-
and missing data in geographical address information,
variate, multi-modal, incomplete and temporal data.
as well as confidence in the values in the data fromself-reported illnesses. All of this must be numerically orcategorically represented in the transformations and then
Purpose-driven visual representation
visually conveyed effectively to the user.
Just as challenging is creating visual representations
As mentioned above, a key component in determining
that enable the user to analyze data across multiple scales,
effective visual representations is the purpose of the
described in a previous article in this volume. Cross-
visualization – what is the task the user is performing?
scale reasoning is necessary in many systems that require
Cognitive task analysis is a highly active research area,
visual analytic solutions to manage the complexity of
and many classifications of tasks have been developed.
the analysis task. Appropriate abstraction and aggrega-
Two key factors in determining the appropriate visual
tion of data to enable this cross-scale visual reasoning is
representation are the type of task and time-scale of
the task. Discovery, verification, inquiry and situationalawareness tasks all have different characteristics thatlead to different visual representations. For instance, in
Visual representation solutions
situational awareness displays, the representation needsto succinctly convey all of the relevant situational vari-
A large toolbox of visual representation techniques can
ables at a summary level, while highlighting unusual
be brought to bear on visual analytic problems with
values/events. In contrast, in a verification or inquiry
large and challenging data characteristics. Shape and
task, detailed information presented clearly and enabling
color have been well studied for representing data values.
comparative or correlative analysis is necessary.
Some less tested, more interesting techniques include the
The time-scale of the task is equally important. For
displays that users interact with for many hours per dayfor in-depth analysis, complex, rich visual representations
• Transparency – potential for showing temporal data
can be used. However, in real-time decision-making envi-
(past/future), data certainty. Poor at showing defined
ronments, pre-attentive or slightly longer visual informa-
tion transfer may be necessary to convey the information
• Texture patterns – potential for showing aggregation,
quickly enough for effective decision making. In this
clustering, categorical information, uncertainty with
case, low-level perceptual cueing through simple visual
representation such as size, course shape, color and trans-
• Line style variation – heavily used in architec-
parency may be the only viable choices. The frequency
ture, technical and medical illustration for showing
of system use also factors into the visual representa-
certainty/uncertainty, known and missing information,
tion that is appropriate if complex visual mappings are
and temporal characteristics of data.
• Ghosting – great potential value for showing temporal
Data characteristics for visual representations
The above are standard graphical techniques. The key to
visual representations is the integration of graphics design
adapted to visual display are critical to a visual analytics
when building visual analytics systems to increase the
environment’s success. Even with advanced data trans-
formations, many data characteristics still make thevisual representation challenging to enable effectivevisual analysis. For instance, in multi-source data inte-
Challenge synopsis
gration and fusion, it is vital that the data transforma-tions enable the fused data to be visually fused and
Transforming data into effective visual representations
compared – they need to have similar scales, magni-
tudes of error and standard deviations, and they needto permit linear visual interpretation when mapped to
• Classifying when the best visual representation can be
2D, 3D, and perceptual color spaces. Enabling visual
comparison and integration of the resulting data signa-
• Choosing effective visual representations for cross-scale
tures is one key difference between automated data
transformations and visual-analytic data transforma-
• Defining visual representations classes that scale from
tions. Linearizable transformations for uncertainty, confi-
real-time to in-depth slow analysis.
dence, erroneous and missing43 data are also needed
• Characterizing visual representation for confidence,
to enable correct visual interpretation. For instance,
in syndromic surveillance, there is uncertainty in
• Developing effective visual representations for reasoning
syndrome classification from free text, coarseness, errors
Information Visualization Vol. 8, 4, 275 – 285 Conclusion
and the active set method. SIAM Journal on Matrix Analysis andApplications 30(2): 713–730.
The task of transforming and representing massive
8 Lee, D.D. and Seung, H.S. (1999) Learning the parts of objects by
non-negative matrix factorization. Nature 401(6755): 788–791.
amounts of data into comprehensible forms remains a
9 Choo, J., Bohn, S., Park, H. (2009) Two-stage framework for
challenge. The magnitude of the transformation and
visualization of clustered high dimensional data. Proceedings of
representation problem is increasing because the rate at
IEEE Symposium on Visual Analytics Science and Technology:12–13 October, Atlantic City NJ.
which data of all types discussed in this article is growing
10 Scholkopf, B. and Smola, A. (2001) Learning with Kernels:Support Vector Machines, Regularization, Optimization, and Beyond.
Visual analytics relies on effective, reliable transforma-
Cambridge, MA: Massachusetts Institute of Technology Press.
tion and representation methods to distill raw data into
11 Littlestone, N. (1988) Learning quickly when irrelevant attributes
abound: A new linear-threshold algorithm. Machine Learning 2:
forms from which humans can gain insight. As discussed
in this article, there is no single transformation or repre-
12 Agrawal, R., Imielinski, T. and Swami, A. (1993) Mining
sentation method to uniformly address all data issues.
association rules between sets of items in large databases. In:
As well as improving and extending transformation
P. Buneman, and S. Jajodia (eds.), Proceedings of the 1993 ACMSIGMOD International Conference on Management of Data;
and representation methods required for computation,
25–28 May, Washington, DC, NY: Association for Computing
additional investigation is needed to understand the
most appropriate data transformation and representation
13 Roth, D. (1999) Learning in natural language. In: T.L. Dean
method(s) for specific visual analytics tasks.
(ed.) Proceedings of the 16th International Joint Conference onArtificial Intelligence (IJCAI ’99); 31 July–6 August, Stockholm,Sweden. San Francisco, CA: Kaufmann Publishers, pp. 898–904.
14 Ganiz, M.C., Lytkin, N.I. and Pottenger, W.M. (2009) Leveraging
Acknowledgements
higher order dependencies between features for text classification. In: ECMLPKDD ’09: The European Conference on MachineLearning and Principles and Practice of Knowledge Discovery in
Our thanks to Professor Richard Fujimoto, Computational
Databases; 7–11 September, Bled, Slovenia.
Science and Engineering Division, Georgia Institute of Tech-
15 Ganiz, M.C., Kanitkar, S., Chuah, M.C. and Pottenger, W.M.
nology for his valuable input on this manuscript. The anony-
(2006) Detection of interdomain routing anomalies based on
mous reviewers provided excellent comments that improved
higher-order path analysis. In: C.W. Clifton (ed.) Proceedings ofthe Sixth International Conference on Data Mining (ICDM ’06);
18–22 December, Hong Kong. Los Alamitos, CA: IEEE Computer
This work has been supported by the Boeing Company,
the Purdue Regional Visualization and Analytics Center™
16 Buneman, P., Khanna, S. and Tan, W.C. (2001) Why and where:
(PURVAC™) located at the Purdue University in West
A characterization of data provenance. In: J. VandenBussche, andV. Vianu (eds.) Proceedings of the 8th International Conference
Lafayette, IN and the Foundations on Data Analysis and
on Database Theory (ICDT 2001); 4–6 January, London, UK.
Visual Analytics (FODAVA) research initiative located at the
Georgia Institute of Technology in Atlanta GA. PURVAC is
17 Hastie, R., Tibshirani, X. and Friedman, J. (2009) The Elements of
sponsored by the U.S. Department of Homeland Security
Statistical Learning: Data Mining, Inference, and Prediction, 2nd edn. New York: Springer.
(DHS) Science and Technology (S&T) Division. FODAVA is
18 Agresti, A. (2007) An Introduction to Categorical Data Analysis. 2nd
sponsored jointly by the National Science Foundation and
edn. Hoboken, NJ: Wiley-Interscience.
the U.S. Department of Homeland Security.
19 Cowell, R.G., Dawid, A.P., Lauritzen, S.L. and Spiegelhalter,
D.J. (1999) Probabilistic Networks and Expert Systems. New York:Springer.
20 Cox, T. and Cox, M. (2001) Multidimensional scaling. MonographsReferences AUTHOR onStatisticsandAppliedProbability88,2ndedn.BocaRaton,FL:
21 Munzner, T., Guimbretiere, F., Tasiran, S., Zhang, L. and
1 Thomas, J.J. and Cook, K.A. (eds.) (2005) Data representations
Zhou, Y. (2003) TreeJuxtaposer: Scalable tree comparison using
and transformations. In: Illuminating the Path: The Research and
focus+context with guaranteed visibility. Proceedings of the
Development Agenda for Visual Analytics, Chapter 4. Los Alamitos,
International Conference on Computer Graphics and Interactive
CA: IEEE Computer Society Press, pp. 105–136.
Techniques ACM SIGGRAPH 2003 Papers; 27–31 July, San Diego,
2 Robertson, G., Ebert, D., Eick, S., Keim, D. and Joy, K. (2009) Scale
CA. New York: Association for Computing Machinery Press,
and complexity in visual analytics. Information Visualization 8(4):
22 Jain, A. (forthcoming). Data Clustering: 50 Years Beyond K-means.
3 Hotelling, H. (1933) Analysis of a complex of statistical variables
Pattern Recognition Letters, Elsevier.
into principal components. Journal of Educational Psychology 24(7):
23 Wright, W., Schroh, D., Proulx, P., Skaburskis, A. and Cort,
B. (2006) The sandbox for analysis: Concepts and methods.
4 Deerwester, S., Dumais, S., Furnas, G., Landauer, T. and Harshman,
In: R. Grinter, T. Rodden, P. Aoki, E. Cutrell, R. Jeffries, and
R. (1990) Indexing by latent semantic analysis. Journal of American
G. Olson (eds.) Proceedings of the SIGCHI Conference on Human
Society for Information Science 41: 391–407.
Factors in Computing Systems; 22–27 April, Montreal, Quebec,
5 Golub, G. and Loan, C. V. (1996) Matrix Computations. 3rd edn.
Canada. New York: Association for Computing Machinery Press,
London: Johns Hopkins University Press.
6 Howland, P. and Park, H. (2007) Generalizing discriminant
24 Shrinivasan, Y.B. and vanWijk, J.J. (2008) Supporting the
analysis using the generalized singular value decomposition. IEEETransactions on Pattern Analysis and Machine Intelligence 26(8):
Proceedings of the 26th Annual SIGCHI Conference on
Human Factors in Computing Systems; 5–10 April, Florence,
7 Kim, H. and Park, H. (2008) Nonnegative matrix factorization
Italy. New York: Association for Computing Machinery Press,
based on alternating non-negativity-constrained least squares
Information Visualization Vol. 8, 4, 275 – 285
25 Yang, X., Asur, S., Parthasarathy, S. and Mehta, S. (2008) A visual-
33 Card, S., Mackinlay, J. and Shneiderman, B. (1999) Readings
analytic toolkit for dynamic interaction graphs. Proceedings of
in Information Visualization: Using Visualization to Think. San
the 14th ACM SIGKDD Conference on Knowledge Discovery and
Data Mining; 24–27 August, Las Vegas, NV. New York: Association
34 Norman, D. (1993) Things That Make Us Smart: Defending Human
for Computing Machinery Press, pp. 1016–1024. Attributes in the Age of the Machine. Reading, MA: Perseus Books.
26 Schreck, T., Tekusova, T., Kohlhammer, J. and Fellner, D. (2007)
35 Mackinlay, J., Hanrahan, P. and Stolte, C. (2007) Show me:
Trajectory-based visual analysis of large financial time series data.
Automatic presentation for visual analysis. IEEE Transactions onACM SIGKDD Explorations Newsletter 92: 30–37. Visualization and Computer Graphics 13(6): 1137–1144.
27 Adrienko, G., Adrienko, N. and Bartling, U. (2008) Interactive
36 Roth, S. F. and Mattis, J. (1991) Automating the presentation of
visual interfaces for evacuation planning. In: P. Bottoni, and
information. Proceedings of the 7th IEEE Conference on Artificial
S. Levialdi (eds.) Proceedings of the Working Conference on
Intelligence Applications; 24th--28 February, Miami Beach, FL. Los
Advanced Visual Interfaces (AVI ’90); 28–30 May, Napoli, Italy.
Alamitos, CA: IEEE Computer Society Press, pp. 90–97.
New York: Association for Computing Machinery, pp. 472–473.
37 Zhou, M. (1999) Visual planning: A practical approach to
28 Stumpf, S. et al. (2008) Integrating rich user feedback into
automated visual presentation. in: T.L. Dean (ed.) Proceedings of
intelligent user interfaces. In: J. Bradshaw, H. Lieberman, and
the 16th International Joint Conference on Artificial Intelligence
S. Staab (eds.) Proceedings of the 13th International Conference
(IJCAI ’99); 31 July–6 August, Stockholm, Sweden. San Francisco,
on Intelligent User Interfaces (IUI 2008); 13–16 January, Gran
CA: Kaufmann Publishers, pp. 634–641.
Canaria, Spain. New York: Association for Computing Machinery
38 Bier, E. A., Card, S. K. and Bodnar, J. W. (2008) Entity-based
collaboration tools for intelligence analysis. In: D. Ebert, and
29 He, D., Brusilovisky, P., Grady, J., Li, Q. and Ahn, J.-W. (2007)
T. Ertl (eds.) IEEE Symposium on Visual Analytics Science and
How up-to-date should it be? The value of instant profiling and
Technology: VAST ’08; 21–23 October, Columbus, OH. Los
adaptation in information filtering. In: T.Y. Lin (ed.) Proceedings
Alamitos, CA: IEEE Computer Society Press, pp. 99–106.
of the IEEE/WIC/ACM Conference on Web Intelligence; 2–5
39 Svakhine, N., Jang, Y., Ebert, D. S. and Gaither, K. (2005)
November, Silicon Valley, CA. Los Alamitos, CA: IEEE Computer
Illustration and photography-inspired visualization of flows and
volumes. IEEE Visualization (VIS ’05); 23--28 October, Minneapolis,
30 Wen, Z., Zhou, M. and Aggarwal, V. (2007) Context-aware,
MN. Piscataway, NJ: IEEE, pp. 687–694.
40 Svakhine, N., Ebert, D. S. and Andrews, W. M. (2008) Illustration-
A. Puerta, and T. Lau (eds.) Proceedings of the 12th International
inspired depth enhanced volumetric medical visualization. IEEE
Conference on Intelligent User Interfaces; 28–31 January,
Transactions on Visualization and Computer Graphics 15(1): 77–86.
Honolulu, HI. New York: Association for Computing Machinery
41 Chen, W., Zhang, S., Correia, S. and Ebert, D. S. (2008)
Abstractive representation and exploration of hierarchically
31 Wen, Z. and Zhou, M. X. (2008) An optimization-based approach
clustered diffusion tensor fiber tracts. Computer Graphics Forum
to dynamic data transformation for smart visualization. In:
J. Bradshaw, H. Lieberman, and S. Staab (eds.) Proceedings of the
Agrawala, M. et al. (2003) Designing effective step-by-step
13th International Conference on Intelligent User Interfaces (IUI
assembly instructions. ACM Transactions on Graphics TOG 22(3):
2008); 13–16 January, Gran Canaria, Spain. New York: Association
for Computing Machinery Press, pp. 70–79.
43 Kim, H., Golub, G. and Park, H. (2005) Missing value
32 Perry, J. M., Janneck, C. D. and Pottenger, W. M. (2009).
estimation for DNA microarray expression data: Local least
Supporting Cognitive Models of Sensemaking in Analytics
squares imputation. Bioinformatics 21(2): 187–198.
Software Systems. Rutgers University, Center for DiscreteMathematics & Theoretical Computer Science. DIMACS ResearchReport 2009-12. Disclaimer:
The work of authors from Georgia Institute of Technology was supported in part by the NSF/DHS FODAVA-
opinions, findings and conclusions or recommendations expressed in this material are
those of the authors and do not necessarily reflect the views of the National Science Foundation. Information Visualization Vol. 8, 4, 275 – 285
Ammentu, n. 2, gennaio-dicembre 2012, ISSN 2240-7596 Presentación Un año después publicamos el segundo número de «Ammentu», con una novedad. Entre los idiomas que alberga esta revista en adelante se admitirá también la lengua sarda en sus tres variedades principales: el campidanés, el galurés y el logudorés. Hace tiempo que esta dirección barajaba la idea de potenciar el pres
 These collections of bits form primitive data types1
evolution of value changes is often important. Examples
that include text, numbers, still images, audio and
video. Combinations of primitive data forms canbe:
• A snapshot of a given data set (for example, a large set of
documents) freezes geo-location and time at a specific
• Structured (for example, relational tables, geometry).
These collections of bits form primitive data types1
evolution of value changes is often important. Examples
that include text, numbers, still images, audio and
video. Combinations of primitive data forms canbe:
• A snapshot of a given data set (for example, a large set of
documents) freezes geo-location and time at a specific
• Structured (for example, relational tables, geometry).
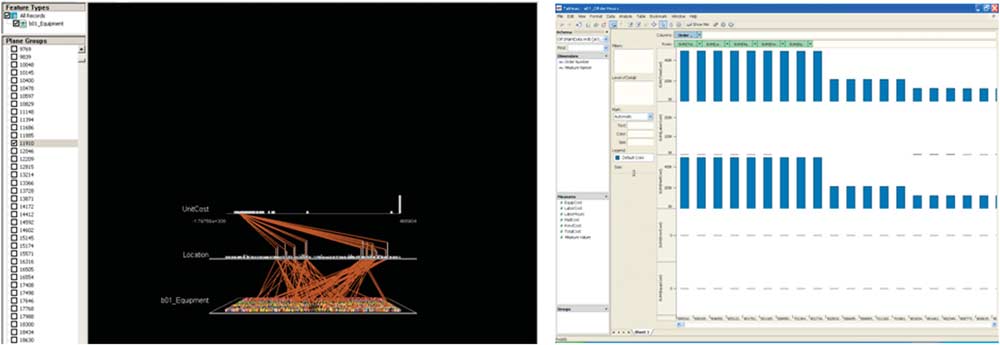 Figure 1:
 extensively in numerous science and engineering prob-
data are discarded. The applicability of feature selec-
lems, including signal, image and text processing. When
tion as a dimension reduction technique has not been
additional information concerning characteristics of the
extensively explored in visual analytics. Promising new
data such as its cluster structure or the fact that data
methods can be expected to arise from the development
values are always non-negative is available, dimension
of a comprehensive theory of automatic feature selec-
reduction methods that reveal this fact can achieve better
tion by sparse recovery. Such methods combine concepts
results. Two examples are Linear Discriminant Analy-
from learning theory and can yield insights into new
sis (LDA)6 for clustered data and non-negative matrix
algorithms (for example, boosting, kernel machines).
extensively in numerous science and engineering prob-
data are discarded. The applicability of feature selec-
lems, including signal, image and text processing. When
tion as a dimension reduction technique has not been
additional information concerning characteristics of the
extensively explored in visual analytics. Promising new
data such as its cluster structure or the fact that data
methods can be expected to arise from the development
values are always non-negative is available, dimension
of a comprehensive theory of automatic feature selec-
reduction methods that reveal this fact can achieve better
tion by sparse recovery. Such methods combine concepts
results. Two examples are Linear Discriminant Analy-
from learning theory and can yield insights into new
sis (LDA)6 for clustered data and non-negative matrix
algorithms (for example, boosting, kernel machines). • human-activity logs that are becoming increasingly
generalization performance if the dimensionality of the
• less formal digital socializing (for example, web logs, RSS
Another example of an explicit STMD transformation14
builds a graph-based data representation15, which consi-ders a given data set as a bipartite graph. This approach
These applications and others like them reveal complex,
increases the performance of supervised learning algo-
time-series data that must be manually monitored for
rithms while leaving the data space’s dimensionality
near real-time analytic results. It is possible to apply tradi-
unchanged. The latter aspect mitigates the exponential
tional algorithms to these data, but doing so typically
growth in dimensionality inherent in feature combina-
pushes analytic results beyond near real-time applica-
tion approaches. Vertices of one partition of the graph
tion. Near real-time results can be accomplished through
correspond to data instances. Vertices of the other parti-
techniques such as sampling and aggregation. Such
tion correspond to features. Two vertices u and v are
techniques often remove or further mask the impor-
connected by an edge (u,v) if feature v has non-zero
tant underlying semantic information analysts seek to
value in instance u. Unlike approaches that assume
discover. New computational transformations are needed
data instances are independent, this approach leverages
to leverage such data in a near real-time visual analytics
higher-order co-occurrence relations between feature
values across different instances and enables virtually any
Kernel methods10 have been applied as an implicit
learning method to take advantage of this rich connec-
data transformation for STMD. A kernel function can be
tivity. Developing an unsupervised analogue will add
viewed as an implicit (nonlinear) mapping of data objects
from the original input space to a high-dimensionalfeature space. The application of learning methods subse-quently takes place in this feature space. The strength
Imperfect data
• human-activity logs that are becoming increasingly
generalization performance if the dimensionality of the
• less formal digital socializing (for example, web logs, RSS
Another example of an explicit STMD transformation14
builds a graph-based data representation15, which consi-ders a given data set as a bipartite graph. This approach
These applications and others like them reveal complex,
increases the performance of supervised learning algo-
time-series data that must be manually monitored for
rithms while leaving the data space’s dimensionality
near real-time analytic results. It is possible to apply tradi-
unchanged. The latter aspect mitigates the exponential
tional algorithms to these data, but doing so typically
growth in dimensionality inherent in feature combina-
pushes analytic results beyond near real-time applica-
tion approaches. Vertices of one partition of the graph
tion. Near real-time results can be accomplished through
correspond to data instances. Vertices of the other parti-
techniques such as sampling and aggregation. Such
tion correspond to features. Two vertices u and v are
techniques often remove or further mask the impor-
connected by an edge (u,v) if feature v has non-zero
tant underlying semantic information analysts seek to
value in instance u. Unlike approaches that assume
discover. New computational transformations are needed
data instances are independent, this approach leverages
to leverage such data in a near real-time visual analytics
higher-order co-occurrence relations between feature
values across different instances and enables virtually any
Kernel methods10 have been applied as an implicit
learning method to take advantage of this rich connec-
data transformation for STMD. A kernel function can be
tivity. Developing an unsupervised analogue will add
viewed as an implicit (nonlinear) mapping of data objects
from the original input space to a high-dimensionalfeature space. The application of learning methods subse-quently takes place in this feature space. The strength
Imperfect data solutions that are insensitive to perturbations in input or
• A combination of quantitative and qualitative infor-
conditions are needed, as are stable algorithms that reli-
mation. This is the case when quantitative physical
measurements are combined with qualitative human
Another important challenge arises when there is the
judgment that takes the form of text.
solutions that are insensitive to perturbations in input or
• A combination of quantitative and qualitative infor-
conditions are needed, as are stable algorithms that reli-
mation. This is the case when quantitative physical
measurements are combined with qualitative human
Another important challenge arises when there is the
judgment that takes the form of text. All of the above techniques take on an additional
first published in 1955.22 The best clustering approach is
burden when placed in the context of a person. Humans
often very closely tied to the end goals of the intended
have limited faculties (physical, mental and otherwise)
users. For example, the task of binary clustering of a collec-
that must be addressed by viable solutions if they are to
tion of animals may produce two completely different
be used in the context of visual analytics. For example,
groups, such as mammals versus birds or predators versus
while the winner of the InfoVis 2003 Contest21 could
non-predators, depending on the features used to repre-
computationally compare two trees of 100 000 elements
each, it also provided several interface methods to support
In visual analytics, experts can often provide addi-
a human’s understanding and navigation. Data with
tional information. This can be realized by designing
high-order dimensionality must be reduced to two or
clustering methods that use human-specified constraints.
All of the above techniques take on an additional
first published in 1955.22 The best clustering approach is
burden when placed in the context of a person. Humans
often very closely tied to the end goals of the intended
have limited faculties (physical, mental and otherwise)
users. For example, the task of binary clustering of a collec-
that must be addressed by viable solutions if they are to
tion of animals may produce two completely different
be used in the context of visual analytics. For example,
groups, such as mammals versus birds or predators versus
while the winner of the InfoVis 2003 Contest21 could
non-predators, depending on the features used to repre-
computationally compare two trees of 100 000 elements
each, it also provided several interface methods to support
In visual analytics, experts can often provide addi-
a human’s understanding and navigation. Data with
tional information. This can be realized by designing
high-order dimensionality must be reduced to two or
clustering methods that use human-specified constraints. • Uncertainty is caused by a number of different data
effective analytic environments, visual metaphors are
characteristics. Estimating this uncertainty and commu-
needed for different data representations, including
nicating it in a meaningful way is an important chal-lenge. Deriving value when the quality of the data varies
significantly. For example, human language differences
• data signatures and transformed data;
change the meaning of words in text, video and audio;
• metadata information including related data, transfor-
noise in sensors affects numeric data.
• Uncertainty is caused by a number of different data
effective analytic environments, visual metaphors are
characteristics. Estimating this uncertainty and commu-
needed for different data representations, including
nicating it in a meaningful way is an important chal-lenge. Deriving value when the quality of the data varies
significantly. For example, human language differences
• data signatures and transformed data;
change the meaning of words in text, video and audio;
• metadata information including related data, transfor-
noise in sensors affects numeric data. effective visual representation for multi-source, multi-
and missing data in geographical address information,
variate, multi-modal, incomplete and temporal data.
effective visual representation for multi-source, multi-
and missing data in geographical address information,
variate, multi-modal, incomplete and temporal data. Conclusion
 25 Yang, X., Asur, S., Parthasarathy, S. and Mehta, S. (2008) A visual-
33 Card, S., Mackinlay, J. and Shneiderman, B. (1999) Readings
analytic toolkit for dynamic interaction graphs. Proceedings of
in Information Visualization: Using Visualization to Think. San
the 14th ACM SIGKDD Conference on Knowledge Discovery and
Data Mining; 24–27 August, Las Vegas, NV. New York: Association
34 Norman, D. (1993) Things That Make Us Smart: Defending Human
for Computing Machinery Press, pp. 1016–1024.
25 Yang, X., Asur, S., Parthasarathy, S. and Mehta, S. (2008) A visual-
33 Card, S., Mackinlay, J. and Shneiderman, B. (1999) Readings
analytic toolkit for dynamic interaction graphs. Proceedings of
in Information Visualization: Using Visualization to Think. San
the 14th ACM SIGKDD Conference on Knowledge Discovery and
Data Mining; 24–27 August, Las Vegas, NV. New York: Association
34 Norman, D. (1993) Things That Make Us Smart: Defending Human
for Computing Machinery Press, pp. 1016–1024.