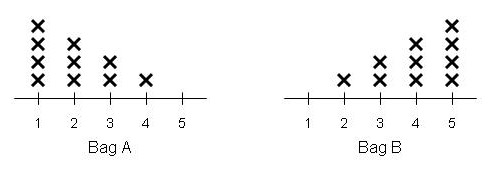
1. (21 pts) There are two bags, Bag A and Bag B, which appear identical from
the outside. Each bag contains 10 vouchers, with values distributed as shownin the diagram below. You are presented with one of the bags and you drawa voucher from it. Based on the value of the voucher that you drew, you willdecide whether you believe it was from Bag A or Bag B. The null and alternativehypotheses are
Your decision rule is to conclude that the bag was Bag B if the voucher is worthat least $4.
(a) (3 pts) What is the direction of extreme?
(d) (4 pts) If the voucher is worth $3, what is the p-value?
(e) (3 pts) If the voucher is worth $5, what is the p-value?
(f) (3 pts) If the voucher is worth $3 and you decide the bag was Bag A, which
2. (6 pts) Some television stations take quick polls of public opinion by announcing
a question on the air and asking viewers to call one of two telephone numbers toregister their opinion as Yes or No. Telephone companies make available “900”numbers for this purpose. Dialing such a number results in a small charge toyour telephone bill. One such call-in poll finds that 73% of those who calledare opposed to a proposed local gun control ordinance. Give two reasons whythis survey may be biased. In answering this question, assume that the purposeof the poll was to assess the proportion of all adults in the viewing area whooppose the ordinance.
3. (9 pts) Mr. Jones’ statistics class has 17 students, who sit in rows 1 - 4.
Row 4: Maria, Nate, Ophelia, Philippe, Rita
To select a random sample from the class, Mr. Jones decides to select 2 (differ-ent) rows at random and then include all the student in those two rows in hissample.
(a) What sampling method is Mr. Jones using?
(b) By this sampling method, what is the probability that Emily will be in the
(c) Using a seed of 154 in your TI-83, tell which two rows Mr. Jones will select.
4. (12 pts) In the previous problem, suppose Mr. Jones asks each student whether
he or she has ever downloaded music to a PC illegally. He then calculates theproportion of the students in the sample who say Yes.
(b) Is this a qualitative or a quantitative variable?
(c) Which does Mr. Jones’ calculation produce?
(d) What type of bias may be present in Mr. Jones’ survey? Explain.
5. (9 pts) Mr. Jones does another study. This time he divides his students by
sex. He then selects at random 3 males and 3 females. He asks each of the 6students how many varsity teams at the school he or she belongs to, suspectingthat boys belong to more teams, on the average, than girls do.
(a) What sampling method did Mr. Jones use?
(b) What is the variable that Mr. Jones is measuring?
(c) Is the variable qualitative, quantitative continuous, or quantitative dis-
6. (18 pts) Allegra is a prescription medication that “provides nondrowsy allergy
relief from seasonal allergy symptoms.” In a test conducted by allergists, eachsubject was given either Allegra or a placebo. An hour later, the researchersasked the subjects whether they felt drowsy. Their conclusion was that drowsi-ness in people who took Allegra was similar to the drowsiness those who took aplacebo (1.3% vs. 0.9%). These results were based on a double-blind, random-ized, placebo-controlled study. The null and alternative hypotheses were
H0: The percentage of Allegra patients experiencing drowsiness is the
same as the percentage of placebo patients experiencing drowsiness.
H1: The percentage of Allegra patients experiencing drowsiness is greater
than the percentage of placebo patients experiencing drowsiness.
The test results were found to be not significant at the 5% level.
(b) What type of error could have been committed?
(c) Give a possible p-value for the test results.
(d) Was this an observational study or a designed experiment? Explain.
(e) What is the explanatory variable.
7. (12 pts) The following table shows the suicide rates for the 5 countries with the
Source: http://www.aneki.com/suicide.html
(a) (3 pts) Which type of graphic would be more appropriate for these data,
a bar graph or a histogram? Explain.
(b) (3 pts) Explain why a pie chart would not be an appropriate graphic for
(c) (6 pts) Draw the graphic that you selected in part (a). Remember the
“Postage Stamp” Rule: I should not be able to cover your diagram with apostage stamp.
8. (13 pts) If you select a certain residential long distance company, you can earn
AT&T points for different magazines. There are 25 magazines to choose from. The points needed to redeem each are listed below.
370 310 400 500 310 560 370 470 470 560310 630 370 400 910 910 660 370 560 500870 470 630 600 470
(a) (5 pts) List the classes you will use to draw a histogram, showing both
endpoints of each class and using an appropriate notation.
(b) (5 pts) Using the classes from part (a), draw a histogram of the data.
(c) (3 pts) Describe the shape of the distribution, using appropriate statistical
Editorial Commentary Migrainous stroke Reports of migraine-associated stroke appear in the medical literature with regularity, but uncertainty persists as to themechanisms which may generate this uncommon complication of a common condition. In their article in this issue Drs Saninand Mathew describe a patient with migrainous stroke and arteriographic findings consistent with diffuse cerebral
Pertussis, or whooping cough, is a highly contagious bacterial infection that causes an uncontrollable, violent cough lasting several weeks or even months. It is caused by a bacterium that is found in the mouth, nose and throat of an infected person. Pertussis may begin with cold-like symptoms or a dry cough that progress Pertussis can occur at any age. Children who are too young to be fully va
 1. (21 pts) There are two bags, Bag A and Bag B, which appear identical from
the outside. Each bag contains 10 vouchers, with values distributed as shownin the diagram below. You are presented with one of the bags and you drawa voucher from it. Based on the value of the voucher that you drew, you willdecide whether you believe it was from Bag A or Bag B. The null and alternativehypotheses are
Your decision rule is to conclude that the bag was Bag B if the voucher is worthat least $4.
1. (21 pts) There are two bags, Bag A and Bag B, which appear identical from
the outside. Each bag contains 10 vouchers, with values distributed as shownin the diagram below. You are presented with one of the bags and you drawa voucher from it. Based on the value of the voucher that you drew, you willdecide whether you believe it was from Bag A or Bag B. The null and alternativehypotheses are
Your decision rule is to conclude that the bag was Bag B if the voucher is worthat least $4.