Interpopulation, interindividual, intercycle, and intracycle natural variation in progesterone levels: a quantitative assessment and implications for population studies
AMERICAN JOURNAL OF HUMAN BIOLOGY 20:35–42 (2008)
Interpopulation, Interindividual, Intercycle, and Intracycle Natural Variation inProgesterone Levels: A Quantitative Assessment and Implications forPopulation Studies
GRAZYNA JASIENSKA1,2* AND MICHAL JASIENSKI31Department of Epidemiology and Population Studies, Collegium Medicum, Jagiellonian University, 31-531 Krako´w, Poland2Radcliffe Institute for Advanced Study, Harvard University, Cambridge, Massachusetts 021383Nowy Sacz Business School–National-Louis University, 33-300 Nowy Sacz, Poland
Methodological challenges in studying sex steroid hormones in premenopausal women result from the
existence of variation at three levels: among women from the same population, among menstrual cycles recorded forwomen at different times of the year, and among days of the same cycle. We partitioned, for a Polish rural population,the natural, nonpathological, variation in salivary progesterone concentrations (measured during 14 days of the lutealphase) into the intracycle component (which accounts for 65% of the total variation) and the among-cycle component(the remaining 35% of the total variation). Out of the among-cycle variation in salivary progesterone, as much as 46% isexpressed as differences among individual women (interindividual component); the remaining 54% of variation is dueto differences among cycles of individual women (intercycle, within-women component). Such intercycle variation isprobably caused by a seasonality of agricultural workload and is much higher than in nonseasonal, industrial popula-tions. We also used bootstrap analyses to generate heuristic recommendations for choosing sample sizes of the numberof subjects, number of cycles per woman, and number of days per cycle. Studies in populations with seasonal lifestylesshould rely on measurements of at least three cycles per woman. Given the substantial intracycle amplitude in hormonelevels to reliably assess biologically and medically relevant variation in ovarian function, at least 7–8 days/cycle shouldbe measured. Am. J. Hum. Biol. 20:35–42, 2008.
The assessment of sex steroid hormones in women is
We hypothesize that populations should differ in the
of crucial importance for many areas of human biology,
amount of exhibited variation in levels of ovarian steroid
behavior, reproductive health, and disease prevention.
hormones, because the amount of expected variation
Levels of estradiol and progesterone are used to test
should vary in relation to the lifestyles characterizing
women in different populations. Nonindustrial populations
(Ellison, 2001; Jasienska, 2003), reproductive and behav-
experience pronounced seasonal changes in lifestyle (e.g.,
ioral ecology (Ellison, 2003b; Holman et al., 2004; Jasien-
energy intake and energy expenditure) associated, for
ska and Ellison, 1998, 2004; Vitzthum et al., 1994), cogni-
example, with agricultural workloads (Jasienska and Elli-
tion, and mate choice (DeBruine et al., 2005; Feinberg
son, 1998; Jasienska and Ellison, 2004; Panter-Brick and
et al., 2006; Jones et al., 2005; Mead and Hampson, 1997;
Ellison, 1994). Consequently, such populations should be
Pawlowski and Jasienska, 2005; Schultheiss et al., 2003;
characterized by higher intercycle variation than interin-
Sherwin, 2005; Williams, 1998). They are also focus of
dividual variation. In contrast, urban populations, with-
research as potential biomarkers of reproductive and sys-
out seasonal changes in lifestyle, should exhibit higher
temic aging (Ferrell et al., 2005), risk of osteoporosis
interindividual variation than intercycle variation. Rela-
(Hillard and Nelson, 2003), and hormone-dependent can-
tively low intercycle variation in progesterone levels
cers (Kaaks et al., 2005; Noh et al., 2006; Pike et al.,
among cycles of individual woman have been reported by
the previous studies (Gann et al., 2001; Lenton et al.,
However, population and clinical research on sex ste-
1983; Sukalich et al., 1994) of urban women from the
roids faces challenges because of the existence of substan-
United States and the United Kingdom.
tial variation in physiological parameters determining
Our study is the first to investigate, within a traditional
hormone concentrations (see also Himmelstein et al., 1990),
rural population, the partitioning of natural, nonpatholog-
both among individuals and within individuals. Variation
ical, variation in progesterone levels. We have studied the
in hormonal levels exists among populations, amongwomen from one population, among different menstrualcycles of the same woman, and finally during menstrualcycles. First two types of variation are due to genetic, de-
Grant sponsor: Department of Anthropology, Harvard University, Polish
velopmental, and adult lifestyle factors. For example, age-
Committee for Scientific Research, Center for Human and Primate Repro-ductive Ecology (CHaPRE).
related variation results from the lowest steroid hormone
*Correspondence to: Grazyna Jasienska, Department of Epidemiology
levels characterizing women several years after the men-
and Population Studies, Jagiellonian University, Grzego´rzecka 20, 31-531
arche and several years before the menopause, and high-
Krako´w, Poland. E-mail: [email protected]
est levels between 25 and 35 years of age (Lipson and Elli-
Received 17 October 2006; Revision received 23 March 2007; Accepted
son, 1992). However, even when cycles of women of similar
age are compared often substantial differences in hormo-
Published online 26 October 2007 in Wiley InterScience (www.interscience.
TABLE 1. Characteristics of study subjects (n ¼ 22) at the
assayed. It should be noted that preservation of samples
with sodium azide is a recommended method for the radio-immunoassay (RIA), but should not be used if samples are
arranged in order starting from the first day of the men-
strual bleeding. The day before the onset of the next men-
struation was identified as day À1, with the previous days
identified correspondingly. The last 18 daily samples of each
cycle (days À18 to À1) were assayed for progesterone. The
total of 115 menstrual cycles was assayed, with less than
10% daily samples missing due to missed or improper collec-
tion or loss during the laboratory procedure. Samples
bMean length calculated from 3 to 6 cycles per woman.
belonging to a particular cycle were analyzed in the sameassay, with cycles from two different subjects run in each
extent of variation in salivary levels of progesterone at
three levels: among women from the same population,
Progesterone was measured in each subject’s samples
among menstrual cycles recorded for women at different
by the RIA according to published protocols (Ellison and
times of the year, and among days of the same cycle. We
Lager, 1986). Quality control was maintained through
have also used bootstrap resampling methods to generate
monitoring values of saliva pools at low (follicular), me-
heuristically useful recommendations aimed at improving
dium (luteal), and high (pregnancy) levels. Assay sensitiv-
statistical quality of data generated in the area of repro-
ity, that is, the smallest amount distinguishable from 0
ductive endocrinology, human evolutionary ecology, and
with 95% confidence, averaged 22.5 pmol/l. Intraassay
variability (CV) at the 50% binding point of the standardcurve was 6.3%. Interassay variability estimated frompools containing various levels of progesterone averaged
20.2% for low (late follicular/early luteal) pools, 10.7% for
medium (mid-luteal) pools, and 13.9% for high (preg-
Study participants were 22 women from a small agricul-
tural village located in Beskid Wyspowy mountain rangein Southern Poland (the Mogielica Human Ecology Study
Statistical analysis of variance components
Site). The study was approved by the Committee on theUse of Human Subjects at Harvard University. Women
Data on progesterone concentrations from the last 14
were between 23 and 39 years of age, and met the follow-
days (À14 to À1) representing the luteal phase of the men-
ing criteria for participation: regular menstrual cycles
strual cycle were transformed to natural logarithms and
and no fertility problems, no gynecological and chronic dis-
analyzed in a two-level nested (hierarchical) analysis of
orders (i.e., diabetes and hypo/hyperthyroidism), no
variance (Table 2). In the model, individual women repre-
instances of taking any hormonal medication or using hor-
sented the upper level and cycles collected in different
monal contraception during the 6 months before recruit-
months represented the lower level (with cycles nested
ment, and not having been pregnant or lactating during
within women; see Table 3). A random model was used,
the 6 months before recruitment. Anthropometric charac-
implying that both individual women and, for the purpose
teristics of participants are presented in Table 1. Life in
of this article, also individual cycles-months were consid-
the village is characterized by intense seasonality in phys-
ered random samples taken from a larger population. Tests
ical workload imposed by requirements of haying and har-
of significance followed the traditional (Expected Mean
vest season. Levels of energy expenditure of the summer
Squares) ANOVA approach, while variance components
months were significantly higher than the energy expend-
and their 95% confidence intervals were computed accord-
iture of winter months (Jasienska and Ellison, 2004). Diet
ing to the REML (Restricted Maximum Likelihood) proce-
was sufficient through the year and women did not loose
dure, as implemented in the JMP package (Version 5.0,
weight or body fat when physical work was the most
intense (Jasienska and Ellison, 1998, 2004).
The variance components associated with variation
among women (interindividual) and variation amongcycles (intercycle) within women were expressed either as
fractions of the total variance (which included the resid-
Subjects collected daily saliva samples for a total of 6
ual, variance component) or were expressed relative to
months, from June to October 1992 and in January and
each other to allow comparisons with other published
February 1993. Each woman was provided with a set of
studies (Gann et al., 2001; Sukalich et al., 1994). A similar
polystyrene collection tubes pretreated with sodium azide
analysis was performed for the mid-luteal phase data
as a preservative, a calendar for keeping records of sample
(days À11 to À6, which were chosen based on preliminary
collection and marking menstrual dates, and pretested
investigations of within-cycle patterns of variation;
chewing gum to be used as the stimulant of saliva flow.
Subjects were requested to collect samples daily, in theevening, at least 30 min after last meal. Very few omis-
sions occurred. Samples were stored at room temperatureuntil the end of each collection period and then trans-
All bootstrap procedures were written in the Resam-
ported to the laboratory and frozen at À208C until
pling Stats environment (version 4.0 for the Macintosh)
American Journal of Human Biology DOI 10.1002/ajhb
TABLE 2. Two-level random model nested analysis of variance of log-transformed progesterone levels, measured in 22 women
from the Mogielica Human Ecology Study Site, Poland
Days –14 to –1 (entire luteal phase)a
aData from all 14 days of the luteal phase of the cycle.
bData from the mid-luteal phase (6 days).
TABLE 3. Mean daily luteal phase progesterone levels (in pmol/L; computed from untransformed data) during the 6 months of the study
Day –1 represents the last day of the cycle. Standard deviation and sample size are in parentheses.
and had a similar structure: progesterone data were used
that estimated intra- versus interindividual variation
either as raw measurements (for the assessment of the
based on only two cycles per woman, we performed explor-
optimal number of days per cycle) or as cycle means (for
atory nested analyses of variance and computed variance
the assessment of the number of women and the number
components for all possible pairs of cycle-months in our
of cycles per woman). The criterion for the assessment of
study (15 pair-combinations of six cycles). We also boot-
the amount of noise in the results was the coefficient of
strapped data on the 12 women for whom the data were
variation (CV), which quantified the interindividual
complete for all six cycles to study how the number of
(among-women) variance in the bootstrapped sample (of a
cycles per woman influences the reliability of the esti-
given size). There were 100,000 bootstrap samples taken
mates of interindividual variation. Each cycle in the boot-
and average within-sample CV was computed for each
strap analysis was represented by its average progester-
sample size. All CVs are presented in figures recalculated
relative to the value which always corresponded to the
The impact of the number of measured days per cycle
largest tested sample size (of either 6 cycles, 14 days per
was investigated using data on 109 Polish women (a sub-
cycle, or 150 subjects). Additional graphs illustrate the
set of 185 subjects; see above) whose luteal progesterone
rate with which increasing sample size affects the statisti-
profiles for days À14 to À1 were without missing data
points. Altogether 26 rural and 83 urban women were
Interindividual variation (among subjects) was eval-
included in bootstrap analyses, generating samples of 1
uated for different sample sizes (from 2 to 150 subjects)
through 14 days per cycle. Analyses of the urban women
using data from a separate database on 185 Polish women
used three sets of 40 women randomly chosen from all 83
(49 rural and 136 urban) whose hormonal profiles were
women; the results for three urban sets and the rural set
measured (one cycle per woman). Average concentrations
of progesterone during the measured cycles ranged among
The amplitude of hormone concentrations during a cycle
these women from 20.1 to 368.6 pmol/l (mean 128.18
may be expressed as a ratio of the nontransformed maxi-
pmol/l, CV ¼ 0.477). Details and laboratory procedures
mum to the minimum value. Although analysis of ratios
have been published elsewhere (Jasienska et al., 2004,
may have disadvantages (Jasienski and Bazzaz, 1999),
2006b). Each woman in the bootstrap analysis was repre-
their use here is not for statistical inference but solely for
sented by the mean progesterone level of her cycle.
the purpose of illustrating the extent of within-cycle varia-
To evaluate the reliability of an approach, encountered
tion. In addition, to reduce the impact of the extremely low
in other studies (Gann et al., 2001; Lenton et al., 1983)
values from the beginning and the end of the luteal phase
American Journal of Human Biology DOI 10.1002/ajhb
Interindividual variation among 22 women (ranked according to the mean progesterone level of each woman) and intercycle variation
(among cycles of each woman). Each dot represents mean value (computed from untransformed data) of a single cycle of the luteal-phase (days
Interindividual variation increases asymptotically as a function of the number of subjects in the study. The inset shows that estimates
of interindividual variation change initially with each additional 2 women sampled, but sampling more subjects than n ¼ 20 yields only mar-
ginal changes in the estimates of interindividual variation.
(the use of which could result in artifactually high values
(days À11 to À6), the interindividual and intercycle com-
of amplitude), we also computed amplitudes only for days
ponents of variance become, 55 and 45%, respectively
À12 through À3 of the luteal phase (one cycle had a mini-
mum concentration of zero on one of the days and wasexcluded).
Partitioning the interindividual and intercycle
If there is only one cycle profile reliably evaluated for
each woman, the average CV among 20 subjects’ proges-
Two sources of natural variation in progesterone con-
terone means is about 99% of that calculated among n ¼
centrations, i.e., differences among women (interindi-
150 subjects, while a sample of six women reaches 95%
vidual) and differences among cycles of individual women
(Fig. 2). However, if cycle means are based on incomplete
(intercycle), had each highly statistically significant and
hormonal profiles (see below), this fact affects the neces-
very similar contributions to the overall observed varia-
sary sample size for the number of subjects. Further, with
tion in the data. Expressed relative to each other, i.e.,
each subject measured, the interindividual variability (as
without taking into account the residual (intracycle) vari-
a measure of both biological variation and sampling varia-
ation, the interindividual level accounted for 46%, and the
tion) increases at a declining rate. Beyond the sample size
intercycle (within-women) level accounted for 54% of vari-
of 20–25 subjects, each additional two women measured
ation, with overlapping 95% confidence limits for variance
contributed a similar fraction to the precision of the analy-
components (Figs. 1 and 6D; Table 2). When the analysis
sis. In other words, the gains from increasing sample size
is performed only on the data from the mid-luteal phase
are substantial for samples of up to 20 women.
American Journal of Human Biology DOI 10.1002/ajhb
Interindividual variation as a function of the number of
cycles sampled per each subject in the study. The number next to each
Distribution of intracycle amplitudes of progesterone con-
symbol shows how quickly interindividual variation decreases with
centrations, computed as ratios of untransformed maximum and min-
each additional cycle measured per woman, e.g. measuring 2 rather
imum values recorded between days À1 and À14 (filled bars) and
than 1 cycles reduces interindividual variation 1.12 times, and mea-
between days À3 and À12 (open bars); n ¼ 114 cycles of 22 women
suring 3 rather than 2 cycles reduces interindividual variation an
additional 1.05 times. The analysis assumes that cycle means areevaluated reliably (minimum 7-8 days per cycle).
Number of cycles per woman for the assessment of the
Fifteen analyses of variance based on only two cycle-
months per woman yielded estimates of interindividualvariation (traditionally quantified by the intraclass corre-lation coefficient, ICC) ranging from 0.04 to 0.87 (mean0.335). The estimates of ICC varied therefore widely (20-fold) and depended strongly on the choice of particularpairs of cycle-months, showing clearly that a sample oftwo cycles per woman is not sufficient to capture naturalvariation among cycles (due in part to a seasonal lifestylein the studied population).
The increase in interindividual variation as a function of
A bootstrap approach showed that an optimum number
the number of days sampled per each cycle. The magnitude of
of months to be sampled per woman in a seasonal rural
increase was scaled with respect to the level of variation for the case
population appear to be not fewer than four (Fig. 3). An
in which all 14 days in the cycle have been measured (sampled). Thenumber next to each symbol shows how quickly interindividual varia-
expected positive covariance across cycles of a single
tion decreases with each additional day measured per cycle, e.g.
woman (who may tend to produce generally high or gener-
measuring 2 rather than 1 day per cycle reduces interindividual vari-
ally low levels of hormones) reduces the estimates of inter-
ation 1.20 times, and measuring 3 rather than 2 days per cycle
cycle variation and, therefore, means that fewer cycles per
reduces interindividual variation an additional 1.08 times.
woman should be sampled, than without the intercycle co-variance. However, a pronounced seasonality of workloador dietary intake will probably reduce such intraindivid-
nested design (‘ interindividual’’ and ‘‘intercycle within
women’’) together accounted for only 35.5% of total var-
In terms of the actual difference in the magnitude of
iance (Table 2). Among the 114 computed measures of
interindividual variation, sampling of just two rather
within-cycle amplitude (pooling all measured cycles from
than six cycles per woman entails about 10% rise in varia-
22 women), values ranged from 2.2 to 22.7 times (n ¼ 114,
tion, resulting in a 10% reduction of effect size and a con-
mean 6.37, median 4.90), which means that during some
sequent rise in the probability of Type II error (Cohen,
cycles progesterone concentrations varied almost 23-fold
1988). Sampling three versus six cycles leads to a 5%
(Fig. 4, filled bars). Using conservatively only days À12 to
lower effect size. Importantly, we may assume that the
À3 of the luteal phase (thus excluding potentially very low
sample size requirements for nonseasonal populations are
hormone levels), the within-cycle amplitudes ranged from
easier to fulfill and even a single cycle per woman would
1.7 to 13.8 (mean 4.18, median 3.58) (Fig. 4, open bars). In
be sufficient to provide adequate statistical power. How-
the group of 185 urban and rural women, the within-cycle
ever, this liberal conclusion is contingent upon the use of
amplitudes of progesterone concentrations (for days À14 to
full hormonal profiles, rather than single-day snapshots
À1) ranged from 2.2 to 49.3 times (mean 8.29, median
6.20). These results underscore the importance of sufficientsampling of progesterone concentrations during individualcycles, especially during the luteal phase of the cycle.
Number of days per cycle for the assessment of the
Resampling analyses performed on data from the rural
and urban populations suggest that the requirements for
The intracycle (among-days of a single cycle) variability
a reliable assessment of progesterone production are quite
in progesterone levels constituted the largest source of
stringent: at least 7 or 8 days per 14-day luteal phase of
variation in our data: the residual component accounted
the cycle should be measured (Fig. 5). The sampling of
for 64.5% of total variance, while the two levels in the
fewer than 5 days per cycle increases the level of variation
American Journal of Human Biology DOI 10.1002/ajhb
Variance components associated with interindividual and intercycle (within-women) sources of variation in progesterone levels. A.
Data published by Lenton et al. (1983) on 17 women (2 cycles per woman) from the United Kingdom. B. Data published by Sukalich et al.
(1994) on 12 women (4 cycles per woman) from the Boston area, USA. C. Data published by Gann et al. (2001) on 12 women (2 cycles per
woman) from the Chicago area, USA. D. Results of this study (22 women, on average 5.2 cycles [from 3 to 6] per woman) conducted at the
Mogielica Human Ecology Study Site [MHESS], Poland.
in the data by more than 10%, thus reducing the effect size
woman (among-cycles) variation in mean steroid hormone
by this fraction and substantially lowering statistical power.
levels has been documented in a study showing that con-ception cycles were characterized by higher levels of estra-diol than nonconception cycles of the same woman (Lipson
Levels of sex steroid hormones in premenopausal women
are influenced by many factors: genes, early developmental
Energetic factors, especially for women whose lifestyle
conditions and adult lifestyle. Influence of adult lifestyle
is characterized by seasonal changes, are most likely to
has been most intensely studied and is best understood. In
account for significant proportion of variation in ovarian
particular, changes in energetic condition of an individual
function (Ellison, 1994; Jasienska and Thune, 2001). In
caused by low calorie diet, weight loss, or increased energy
rural Congo (Ellison et al., 1986) and Nepal (Panter-Brick
expenditure were related to reproductive suppression
and Ellison, 1994), women had suppressed levels of ovar-
(reduced levels of hormones, inadequate luteal phase, anov-
ian steroid hormones during seasons when they lost
ulatory cycles, oligomenorrhea, and amenorrhea) in pre-
weight due to low caloric intake or high energy expendi-
menopausal women (Bullen et al., 1985; Chen and Brzyski,
ture. In rural Poland, increase in energy expenditure
1999; De Souza, 2003; De Souza et al., 1998; Ellison and
imposed by requirements of harvest season resulted in
Lager, 1986; Jasienska and Ellison, 1998, 2004; Jasienska
suppressed levels of progesterone, even though increase
et al., 2006c; Lager and Ellison, 1990; Morris et al., 1999;
in workload was not associated with weight loss or reduc-
Panter-Brick and Ellison, 1994; Rosetta et al., 1998; War-
tion in body fat (Jasienska and Ellison, 1998, 2004). How-
ren and Perlroth, 2001; Williams et al., 1999).
ever, even during periods when women from Nepal,
In women from the United States, a loss of as little as 2
Congo, Bolivia, and rural Poland have good nutritional
kg of body weight correlated with reduced salivary proges-
status, they still have lower levels of ovarian steroids than
terone levels, even though after the weight loss, women
women from the United States (Ellison et al., 1993).
were still in comparably good nutritional conditions (La-
Variation in hormonal production may therefore be
ger and Ellison, 1990). Participation in recreational sport
expected among women from one population, among differ-
also resulted in suppressed levels of ovarian steroids. For
ent menstrual cycles of the same woman, and finally,
example, college-age women had reduced levels of salivary
among populations. In women from the United States (Fig.
progesterone when jogging on average for 3 h a week
6B,C), intercycle variance in salivary progesterone levels
(Ellison and Lager, 1986). Furthermore, in Polish urban
accounted for about only 30% of total variance in luteal
and rural women, reduced levels of estradiol in menstrual
phase progesterone (Sukalich et al., 1994) and 27% of var-
cycles were related to high levels of daily, habitual activity
iance of peak progesterone and cumulative progesterone
from 8 days of the luteal phase (Gann et al., 2001). Inter-
Variation among women in hormonal levels may also
cycle variation accounted for about 20% of total variation in
result from differences in developmental conditions
serum progesterone levels (Fig. 6A) assessed for seven con-
(Ellison, 1996). We recently documented that size at birth,
secutive cycle-days in British women (Lenton et al., 1983).
which is an indicator of energetic conditions during intra-
In contrast, our estimate of intercycle variance is substan-
uterine development positively correlates with levels of es-
tially higher and accounts for 54% of variation (Fig. 6D).
tradiol in menstrual cycles (Jasienska et al., 2006b).
Such high intercycle variation may be explained by pre-
Menarcheal age, which to some extent reflects conditions
viously published findings showing that lifestyle of Polish
during childhood growth and development, shows a rela-
women, who were subjects of this study, was characterized
tionship with levels of steroid hormones in menstrual
by substantial seasonal variation in intensity of physical
cycles (Apter, 1996; Vihko and Apter, 1984). In addition,
work, a factor known to impact reproductive physiology
polymorphism in genes involved in steroid metabolism
(Jasienska and Ellison, 1998, 2004). It is therefore likely
has been linked to variation in levels of ovarian hormones
that women experience seasonal changes in levels of
(Feigelson et al., 1998; Jasienska et al., 2006a; Sharp
reproductive hormones paralleling changes in lifestyle
et al., 2004; Small et al., 2005). Clinical relevance of intra-
conditions (Ellison et al., 1989; Jasienska and Ellison,
American Journal of Human Biology DOI 10.1002/ajhb
1998, 2004; Panter-Brick and Ellison, 1994). Although
subjects or the number of cycles per woman, a frequent
data about relevant lifestyle factors (Ellison, 2003a;
research strategy in epidemiology. A sample of just one
Jasienska and Ellison, 1998) were not provided in other
day per cycle reduces the effect size by as much as 50–
studies of interindividual and intercycle variation (Gann
60% (compared to a full 14-measurement luteal phase);
et al., 2001; Lenton et al., 1983; Sukalich et al., 1994), it
maintaining the same power of the t test comparing two
can be expected that higher intercycle variance estimated
groups of women can only be compensated by a fourfold
for the Polish rural women resulted from more seasonally
increase in the number of subjects (Cohen, 1988). In some
variable lifestyle conditions than those characteristic of
instances, this trade-off may be justified by substantially
lower research costs or logistical convenience.
Comparison between results of our study and those of
However, lack of knowledge about the intracycle dy-
studies on urban women (Gann et al., 2001; Lenton et al.,
namics of progesterone production may render more
1983; Sukalich et al., 1994) provides preliminary support
refined analyses impossible. Similarly, replacing it with
to our hypothesis that the pattern of partitioning of varia-
simplistic and potentially misleading ratios of two
tion in levels of ovarian steroids is different in urban ver-
extreme values of hormone concentrations may make the
sus rural populations. In all three studies on women from
ratio-based models statistically untestable (Jasienski and
urban population, the intercycle variation was low and
Bazzaz, 1999). Modeling the hormonal profiles during the
accounted for at most 30% of variation. In our study of a
menstrual cycles as function-valued traits (e.g. Kirkpa-
rural population, the component of intercycle variation
trick and Meyer, 2004) or a search for powerful smoothing
was almost two times higher. However, even in urban set-
models (Brumback and Rice, 1998) may yield novel pa-
tings where seasonality is less likely to play a role as a de-
rameters of explanatory potential, but both cases require
terminant of lifestyle changes, attention should be paid to
full information about daily hormone levels. Of more im-
dieting and exercise as modern lifestyle factors known to
mediate concern, however, is the need to study the entire
affect ovarian physiology. For example, hormonal levels
luteal phase to properly evaluate the timing of the mid-
are expected to be reduced in a woman who recently lost
luteal phase. For example, there are reasons to think that
weight, in comparison to her other cycles during which
the mid-luteal events may carry more biologically mean-
her body weight remained stable (Lager and Ellison,
ingful information than data averaged across the entire
1990). Therefore, a woman who usually produces high lev-
menstrual cycle (Jasienska, unpublished). The ‘‘interindi-
els of hormones may be misclassified as having ovarian
vidual’’ component is particularly pronounced for days
disturbances (e.g., insufficient luteal phase or anovulatory
À11 through À6, which correspond to the mid-luteal
cycle), just because her cycle was sampled at the time
phase. Including the entire luteal phase (days À14 to À1)
in analyses introduces a component of random variationamong cycles, thus potentially elevating the intercycle
Methodological issues: how many measurements?
component (and reducing the interindividual component). This finding may have important implications for repro-
It is worth emphasizing that knowledge of lifestyle con-
ductive ecology and epidemiology since mid-luteal hormo-
ditions of a population is crucial before a decision could be
nal levels are likely to exhibit more meaningful or robust
made if one or more cycles measured per woman provides
correlations with life-historical variables.
a reliable estimate of her hormonal status. Our explora-
The knowledge of the levels of indigenous ovarian ste-
tory analyses of variance based on data from a population
roids of a woman is of unquestionable importance in clini-
characterized by pronounced seasonality yielded an
cal practice and public health. Individual assessment of
extremely broad (20-fold) spectrum of ICC values (var-
hormone levels during menstrual cycle could be important
iance among individual women), which renders question-
in using these values as biomarkers of risk of hormone-
able results of studies relying on few cycles per woman. It
depended cancers. Lifetime levels of estrogens and proges-
can, however, be expected that in urban populations, such
terone are hypothesized to play a crucial role in the devel-
as those studied by Lenton et al. (1983), Sukalich et al.
opment of breast and reproductive cancers in women
(1994), and Gann et al. (2001), characterized by less pro-
(Bernstein and Ross, 1993; Jasienska et al., 2000; Pike
nounced seasonal changes in lifestyle conditions, the
et al., 1993). If they are to serve as reliable biomarkers,
intercycle variation would be lower than that described in
however, it is essential to take into account the existence
our study. In sedentary, stable-weight women, their hor-
of genuine, nonpathological, variation in hormone levels,
monal levels should not change substantially from cycle to
both among individual women and among cycles of a
cycle, thus lowering the required number of measured
The consequences of using insufficient sample sizes are
clear (see e.g., Jasienski, 1996): elevated level of noise(measured by variance or CV) directly translates into a
GJ acknowledges generous support from the Radcliffe
reduction in effect size, which is an important determi-
Fellowship 2005–2006 program. GJ and MJ are grateful
nant of statistical power (Cohen, 1988). To keep the
to the anonymous referee for helpful insights. This is an
desired levels of power requires either an increase in sam-
ple size, a change in the structure of the data (such assampling more cycles per woman), or a change in the na-
ture of the statistical test (e.g., in multiple regression
Apter D. 1996. Hormonal events during female puberty in relation to
analysis, when it may result in the necessity of removing
breast cancer risk. Eur J Cancer Prev 5:476–482.
some of the independent variables from the model).
Bernstein L, Ross RK. 1993. Endogenous hormones and breast cancer risk.
Insufficient sampling at the intracycle level may in
Brumback BA, Rice JA. 1998. Smoothing spline models for the analysis of
principle be compensated by an increase in the number of
nested and crossed samples of curves. J Am Stat Assoc 93:961–976.
American Journal of Human Biology DOI 10.1002/ajhb
Bullen BA, Skrinar GS, Beitins IZ, von Mering G, Turnbull BA, McArthur
Jasienska G, Ziomkiewicz A, Thune I, Lipson SF, Ellison PT. 2006c. Habit-
JW. 1985. Induction of menstrual disorders by strenuous exercise in
ual physical activity and estradiol levels in women of reproductive age.
untrained women. N Engl J Med 312:1349–1353.
Chen EC, Brzyski RG. 1999. Exercise and reproductive dysfunction. Fertil
Jasienski M. 1996. N¼1 fortuitous effects and AIDS research. The Scien-
Cohen J. 1988. Statistical power analysis for the behavioral sciences, 2nd
Jasienski M, Bazzaz FA. 1999. The fallacy of ratios and the testability of
models in biology. Oikos 84:321–325.
De Souza MJ. 2003. Menstrual disturbances in athletes: A focus on luteal
Jones BC, Little AC, Boothroyd L, DeBruine LM, Feinberg DR, Law Smith
phase defects. Med Sci Sports Exerc 35:1553–1563.
MJ, Cornwell RE, Moore FR, Perrett DI. 2005. Commitment to relation-
De Souza MJ, Miller BE, Loucks AB, Luciano AA, Pescatello LS, Campbell
ships and preferences for femininity and apparent health in faces are
CG, Lasley BL. 1998. High frequency of luteal phase deficiency and
strongest on days of the menstrual cycle when progesterone level is
anovulation in recreational women runners: blunted elevation in follicle-
stimulating hormone observed during luteal-follicular transition. J Clin
Kaaks R, Berrino F, Key T, Rinaldi S, Dossus L, Biessy C, Secreto G,
Amiano P, Bingham S, Boeing H, de Mesquita HBB, Chang-Claude J,
DeBruine LM, Jones BC, Perrett DI. 2005. Women’s attractiveness judg-
Clavel-Chapelon FO, Fournier AS, van Gils C, Gonzalez CA, Gurrea AB,
ments of self-resembling faces change across the menstrual cycle. Horm
Critselis E, Khaw KT, Krogh V, Lahmann PH, Nagel G, Olsen A,
Onland-Moret NC, Overvad K, Palli D, Panico S, Peeters P, Quiros JR,
Ellison PT. 1994. Salivary steroids and natural variation in human ovarian
Roddam A, Thiebaut A, Tjonneland A, Chirlaque MD, Trichopoulou A,
function. Ann NY Acad Sci 709:287–298.
Trichopoulos D, Tumino R, Vineis P, Norat T, Ferrari P, Slimani N, Riboli
Ellison PT. 1996. Developmental influences on adult ovarian hormonal
E. 2005. Serum sex steroids in premenopausal women and breast cancer
function. Am J Hum Biol 8:725–734.
risk within the European prospective investigation into cancer and
Ellison PT, editor. 2001. Reproductive ecology and human evolution. Chi-
nutrition (EPIC). J Natl Cancer Inst 97:755–765.
Kirkpatrick M, Meyer K. 2004. Direct estimation of genetic principal com-
Ellison PT. 2003a. Energetics and reproductive effort. Am J Hum Biol
ponents: simplified analysis of complex phenotypes. Genetics 168:2295–
Ellison PT. 2003b. On fertile ground. Cambridge, MA: Harvard University
Lager C, Ellison PT. 1990. Effect of moderate weight loss on ovarian func-
tion assessed by salivary progesterone measurements. Am J Hum Biol
Ellison PT, Lager C. 1986. Moderate recreational running is associated
with lowered salivary progesterone profiles in women. Am J Obstet
Lenton E, Lawrence G, Coleman R, Cooke I. 1983. Individual variation in
gonadotrophin and steroid concetration and in lengths of the follicular
Ellison PT, Peacock NR, Lager C. 1986. Salivary progesterone and luteal
and luteal phases in women with regular menstrual cycles. Clin Reprod
function in two low-fertility populations of northeast Zaire. Hum Biol
Lipson SF, Ellison PT. 1992. Normative study of age variation in salivary
Ellison PT, Peacock NR, Lager C. 1989. Ecology and ovarian function among
progesterone profiles. J Biosoc Sci 24: 233–244.
Lese women of Ituri Forest Zaire. Am J Phys Anthropol 78:519–526.
Lipson SF, Ellison PT. 1996. Comparison of salivary steroid profiles in nat-
Ellison PT, Panter Brick C, Lipson SF, O’Rourke MT. 1993. The ecological
urally occurring conception and non-conception cycles. Hum Reprod
context of human ovarian function. Hum Reprod 8:2248–2258.
Feigelson HS, Shames LS, Pike MC, Coetzee GA, Stanczyk FZ, Henderson
Mead LA, Hampson E. 1997. Turning bias in humans is influenced by
BE. 1998. Cytochrome p450c17 alpha gene (CYP17) polymorphism is
phase of the menstrual cycle. Horm Behav 31:65–74.
associated with serum estrogen and progesterone concentrations. Cancer
Morris FL, Payne WR, Wark JD. 1999. Prospective decrease in progesterone
concentrations in female lightweight lowers during the competition sea-
Feinberg DR, Jones BC, Law-Smith MJ, Moore FR, DeBruine LM, Corn-
son compared with the off season: a controlled study examining weight
well RE, Hillier SG, Perrett DI. 2006. Menstrual cycle trait estrogen
loss and intensive exercise. Br J Sports Med 33:417–422.
level and masculinity preferences in the human voice. Horm Behav
Noh JJ, Maskarinec G, Pagano I, Cheung LWK, Stanczyk FZ. 2006. Mam-
mographic densities and circulating hormones: a cross-sectional study in
Ferrell RJ, O’Connor KA, Rodriguez G, Gorrindo T, Holman DJ, Brindle E,
premenopausal women. Breast 15:20–28.
Miller RC, Schechter DE, Korshalla L, Simon JA, Mansfield PK, Wood
Panter-Brick C, Ellison PT. 1994. Seasonality of workloads and ovarian
JW, Weinstein M. 2005. Monitoring reproductive aging in a 5-year pro-
function in Nepali women. Ann NY Acad Sci 709:234–235.
spective study: Aggregate and individual changes in steroid hormones
Pawlowski B, Jasienska G. 2005. Women’s preferences for sexual dimor-
and menstrual cycle lengths with age. Menopause 12:567–577.
phism in height depend on menstrual cycle phase and expected duration
Gann PH, Giovanazzi S, Van Horn L, Branning A, Chatterton RT. 2001.
of relationship. Biol Psychol 70:38–43.
Saliva as a medium for investigating intra- and interindividual differ-
Pike MC, Spicer DV, Dahmoush L, Press MF. 1993. Estrogens progesto-
ences in sex hormone levels in premenopausal women. Cancer Epide-
gens normal breast cell proliferation and breast cancer risk. Epidemiol
Hillard PJA, Nelson LM. 2003. Adolescent girls the menstrual cycle and
Rosetta L, Harrison GA, Read GF. 1998. Ovarian impairments of female
bone health. J Pediatr Endocr Metab 16:673–681.
recreational distance runners during a season of training. Ann Hum
Himmelstein DU, Levins R, Woolhandler S. 1990. Beyond our means: pat-
terns of variability of physiological traits. Int J Health Serv 20:115–124.
Schultheiss OC, Dargel A, Rohde W. 2003. Implicit motives and gonadal
Holman DJ, Grimes MA, Brindle E, O’Connor KA. 2004. Hormonal corre-
steroid hormones: effects of menstrual cycle phase oral contraceptive
lates for the initiation of breast-feeding in Bangladeshi women. Horm
use and relationship status. Horm Behav 43:293–301.
Sharp L, Cardy AH, Cotton SC, Little J. 2004. CYP17 gene polymor-
Jasienska G. 2003. Energy metabolism and the evolution of reproductive
phisms: prevalence and associations with hormone levels and related
suppression in the human female. Acta Biotheor 51:1–18.
factors. A HuGE review. Am J Epidemiol 160:729–740.
Jasienska G, Ellison PT. 1998. Physical work causes suppression of ovar-
Sherwin BB. 2005. Estrogen and memory in women: How can we reconcile
ian function in women. Proc R Soc Lond B Biol Sci 265:1847–1851.
the findings? Horm Behav 47:371–375.
Jasienska G, Ellison PT. 2004. Energetic factors and seasonal changes in
Small CM, Marcus M, Sherman SL, Sullivan AK, Manatunga AK, Feigel-
ovarian function in women from rural Poland. Am J Hum Biol 16:563–580.
son HS. 2005. CYP17 genotype predicts serum hormone levels among
Jasienska G, Kapiszewska M, Ellison PT, Kalemba-Drozdz M, Nenko I,
pre-menopausal women. Hum Reprod 20:2162–2167.
Thune I, Ziomkiewicz A. 2006a. CYP17 genotypes differ in salivary 17-b
Sukalich S, Lipson S, Ellison PT. 1994. Intra and interwomen variation in
estradiol levels: A study based on hormonal profiles from entire men-
progesterone profiles. Am J Phys Anthropol 18(Suppl):191.
strual cycles. Cancer Epidemiol Biomark Prev 15:2131–2135.
Vihko R, Apter D. 1984. Endocrine characteristics of adolescent menstrual
Jasienska G, Thune I. 2001. Lifestyle hormones and risk of breast cancer.
cycles—Impact of early menarche. J Steroid Biochem Mol Biol 20:231–236.
Vitzthum VJ, Ellison PT, Sukalich S. 1994. Salivary progesterone profiles
Jasienska G, Thune I, Ellison PT. 2000. Energetic factors ovarian steroids
of indigenous Andean women. Am J Phys Anthropol 18(Suppl):201–202.
and the risk of breast cancer. Eur J Cancer Prev 9:231–239.
Warren MP, Perlroth NE. 2001. The effects of intense exercise on the
Jasienska G, Ziomkiewicz A, Ellison PT, Lipson SF, Thune I. 2004. Large
female reproductive system. J Endocrinol 170:3–11.
breasts and narrow waists indicate high reproductive potential in
Williams CL. 1998. Estrogen effects on cognition across the lifespan. Horm
women. Proc R Soc Lond B Biol Sci 271:1213–1217.
Jasienska G, Ziomkiewcz A, Lipson SF, Thune I, Ellison PT. 2006b. High
Williams NI, Bullen BA, McArthur JW, Skrinar GS, Turnbull BA. 1999.
ponderal index at birth predicts high estradiol levels in adult women.
Effects of short-term strenuous endurance exercise upon corpus luteum
function. Med Sci Sports Exerc 31:949–958.
American Journal of Human Biology DOI 10.1002/ajhb
Zappiti™ Unveils Zappiti Player Mini Zappiti Player Mini: a small and powerfull 3D Media Player. Paris, France — April 25, 2012 — Zappiti, a leading provider of home entertainment solutions unveils « Zappiti Player Mini », a new 3D Media Player. Ideal for home AV networking, Zappiti Player Mini is the most affordable Universal Media plateform for Full HD 3D video and audio playba
USING KERNEL DENSITY INTERPOLATION TO VISUALIZE THE EFFECTS OF MASS TREATMENT WITH IVERMECTIN ON HELMINTH PREVALENCE IN RURAL NORTHEAST BRAZIL Department of Geography and Anthropology University of Texas Health Science Center at San Antonio Department of Community Health - School of Medicine Federal University of Ceará – Fortaleza, Brazil Abstract Kernel density estimatio
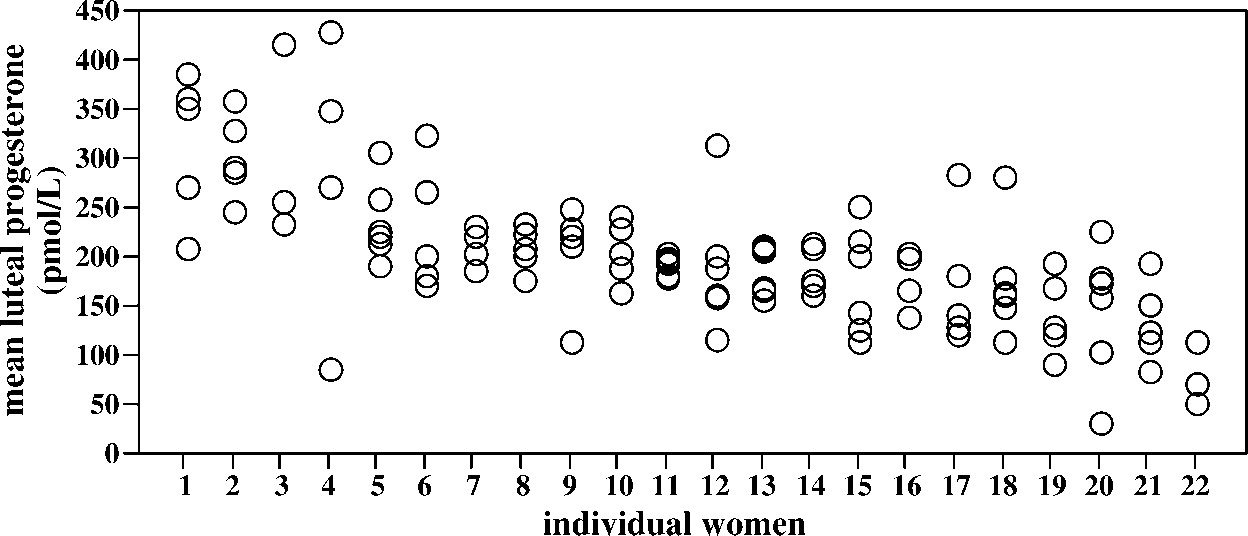
 Interindividual variation among 22 women (ranked according to the mean progesterone level of each woman) and intercycle variation
(among cycles of each woman). Each dot represents mean value (computed from untransformed data) of a single cycle of the luteal-phase (days
Interindividual variation increases asymptotically as a function of the number of subjects in the study. The inset shows that estimates
of interindividual variation change initially with each additional 2 women sampled, but sampling more subjects than n ¼ 20 yields only mar-
ginal changes in the estimates of interindividual variation.
Interindividual variation among 22 women (ranked according to the mean progesterone level of each woman) and intercycle variation
(among cycles of each woman). Each dot represents mean value (computed from untransformed data) of a single cycle of the luteal-phase (days
Interindividual variation increases asymptotically as a function of the number of subjects in the study. The inset shows that estimates
of interindividual variation change initially with each additional 2 women sampled, but sampling more subjects than n ¼ 20 yields only mar-
ginal changes in the estimates of interindividual variation.

 Interindividual variation as a function of the number of
cycles sampled per each subject in the study. The number next to each
Distribution of intracycle amplitudes of progesterone con-
symbol shows how quickly interindividual variation decreases with
centrations, computed as ratios of untransformed maximum and min-
each additional cycle measured per woman, e.g. measuring 2 rather
imum values recorded between days À1 and À14 (filled bars) and
than 1 cycles reduces interindividual variation 1.12 times, and mea-
between days À3 and À12 (open bars); n ¼ 114 cycles of 22 women
suring 3 rather than 2 cycles reduces interindividual variation an
additional 1.05 times. The analysis assumes that cycle means areevaluated reliably (minimum 7-8 days per cycle).
Interindividual variation as a function of the number of
cycles sampled per each subject in the study. The number next to each
Distribution of intracycle amplitudes of progesterone con-
symbol shows how quickly interindividual variation decreases with
centrations, computed as ratios of untransformed maximum and min-
each additional cycle measured per woman, e.g. measuring 2 rather
imum values recorded between days À1 and À14 (filled bars) and
than 1 cycles reduces interindividual variation 1.12 times, and mea-
between days À3 and À12 (open bars); n ¼ 114 cycles of 22 women
suring 3 rather than 2 cycles reduces interindividual variation an
additional 1.05 times. The analysis assumes that cycle means areevaluated reliably (minimum 7-8 days per cycle).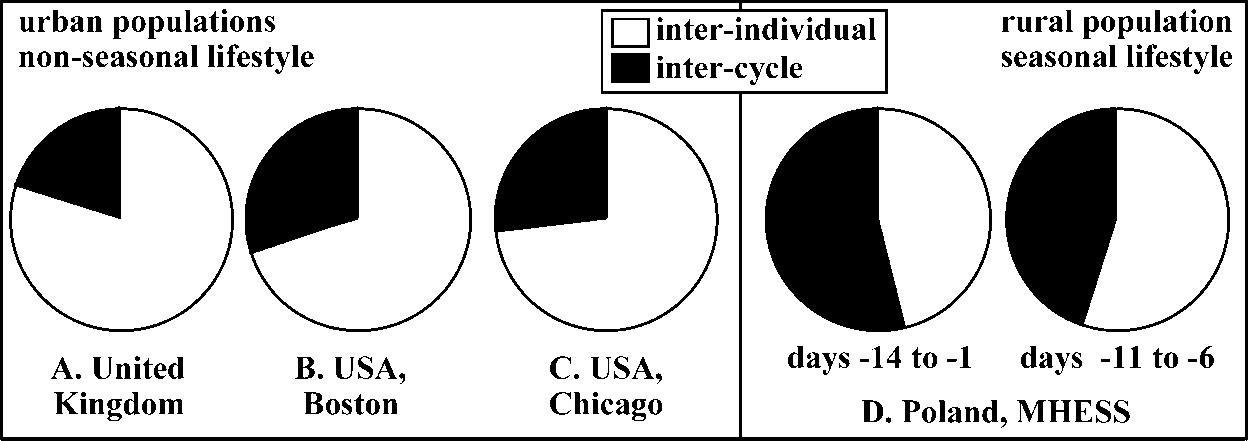 Variance components associated with interindividual and intercycle (within-women) sources of variation in progesterone levels. A.