2001 smith et al.: relationships between, milk production, nutrition and reproduction in “benchmark” herds
Proceedings of the New Zealand Society of Animal Production 61:195-198 Relationships between, milk production, nutrition and reproduction in “benchmark” herds1
J. F. SMITH, G. A. VERKERK1, B. A. CLARK1, B. J. MCKAY2 AND D. M. DUGANZICH
AgResearch Ltd., Ruakura Research Centre, Private Bag 3123, Hamilton
ABSTRACT
Inter-relationships between nutrition, milk production and reproduction in dairy cows were investigated in dairy herds
with previous high reproductive performance. Ten herds were selected as ‘benchmark’ farms from one area of the Waikato. Pasture and supplement intakes, and milk production were monitored on a herd basis. Bulk milk samples were takenweekly from calving through to the first three weeks of mating and assayed for levels of progesterone, urea nitrogen and β-hydroxybutyrate (BOH). Pre-mating oestrus, mating (AI) and pregnancy data were recorded. All data was expressed inrelation to the planned date of mating (PSM) for each farm. Significant between farm differences were detected in all thereproductive parameters but there was no effect of supplement feeding. The mean proportion of cows cycling at PSM was65.6 ± 3.3% (range 50.5 to 81%).The mean proportion of cows pregnant to AI at PSM + 3 weeks was 51.3 ± 2.1% (range43 to 61.5%); at PSM + 6 weeks the mean was 74.5 ± 3.3% (61 to 89.5%); at PSM + 9 weeks it was 84.7 ± 2.2% (74.9 to91.6%) and at PSM + 12 weeks it was 91.3 ± 1.2% ( 85.6 to 95.4%). Bulk milk progesterone rose linearly from a mean of0.5 ng/ml at 8 weeks before PSM to 5.0 ng/ml at PSM and to 6.0 ng/ml three weeks later. The difference between farms atPSM ranged from (2.1 to 7.1 ng/ml). While the pattern of increase in bulk milk progesterone tended to mimic the overallpattern of oestrus activity, there was no relationship in the ranking of farms for these parameters at any time. Bulk milkBOH showed no consistent pattern over the period of measurement and levels ranged between farms in any one week from0.01 to 0.05 mM. Bulk milk urea nitrogen concentration also showed little change on average (7.25 mM) over the pre-mating and mating periods. The significant between-farm differences in these bulk milk parameters did not appear to berelated to reproductive performance. Metabolic indicators measured in bulk milk samples appear of little value for predictingreproductive performance at herd level. Keywords: milk production; reproduction; nutrition INTRODUCTION
consultancy services (Te Awamutu) and having had high
A basic tenet of biological systems is that reproduction
reproductive performance in previous years (interval
is a luxury function and will only occur successfully when
between start of calving and mid-point [50% cows calved]
there is adequate nutrition. Thus, nutrition plays a critical
of 18 days or less), with minimal pharmacological
role in determining the success of reproductive function,
intervention. Five of the farms had a management system
but this occurs in a complex and dynamic manner, especially
that included the feeding of additional maize silage
supplement with pasture during early lactation while the
Effects of cow live weight, body condition score and
remaining five farms had pasture-only systems.
the level of circulating metabolites reflective of nutritionalintake, have all been linked to the incidence of postpartum
Data Collection
anoestrus and conception rates (Moller et al., 1993;
Data collection began three weeks after the start of the
McDougall, 1994; Rhodes et al., 1998; Verkerk & Guiney,
calving period and continued to the end of the first three
1999; Clark et al., 2000). However, the physiological
mechanisms by which these factors exert their effects are
On each farm, at weekly intervals, pre-grazing and post-
still unclear. To expedite the investigation of these effects
grazing assessments of herbage mass were made to
at the herd level there is a need to establish baseline data in
determine the average pasture DM intake for the herds (DMI
herds with high reproductive performance against which
kg/ cow /d). Farm managers determined herd dry matter
intakes of supplements on a weekly basis on each farm.
The current project was established to collect
A bulk milk sample was collected from the vat of each
information on the temporal relationships between dry
farm at weekly intervals and the milk volume recorded.
matter intake, hormone and nutritional metabolite levels in
Milk samples were analysed for urea nitrogen (BMUN)
milk and reproductive performance at a herd level, in herds
and β-hydroxybutyrate (BOH) concentrations using a FT-
with high previous reproductive performance. Two feed
120 auto-analyser (Foss Electric, Denmark). Milk
management systems, one involving maize silage
progesterone concentration was detected using a
supplementation and one pasture-only, were compared. The
commercial RIA kit (Coat-A-Count, Diagnostic Products
information obtained was to be regarded as benchmark
information that will be used to characterise farm systems.
Reproductive data collected included individual cow pre-
mating heats, anoestrous cow treatment, and artificial breeding
MATERIALS AND METHODS
and natural mating information. This data was used to calculate
the herd submission rate in the first three weeks of mating,
Ten commercial dairy farms were selected, based on
herd conception rate to first insemination and, finally, herd
their regular contact with Dairy Production SystemsTM
pregnancy rate on a time-from-start-of-mating basis.
2 Dairy Production Systems, Te Awamutu. Smith et al. – BENCHMARK HERDS FOR REPRODUCTIONData Analysis
on the pasture only farms and two of these exhibited a
All time-based data were centred on the planned start
marked drop in the DMI during a period of low pasture
of mating (PSM) date for individual farms. Data for the
non-reproductive parameters were analysed using the
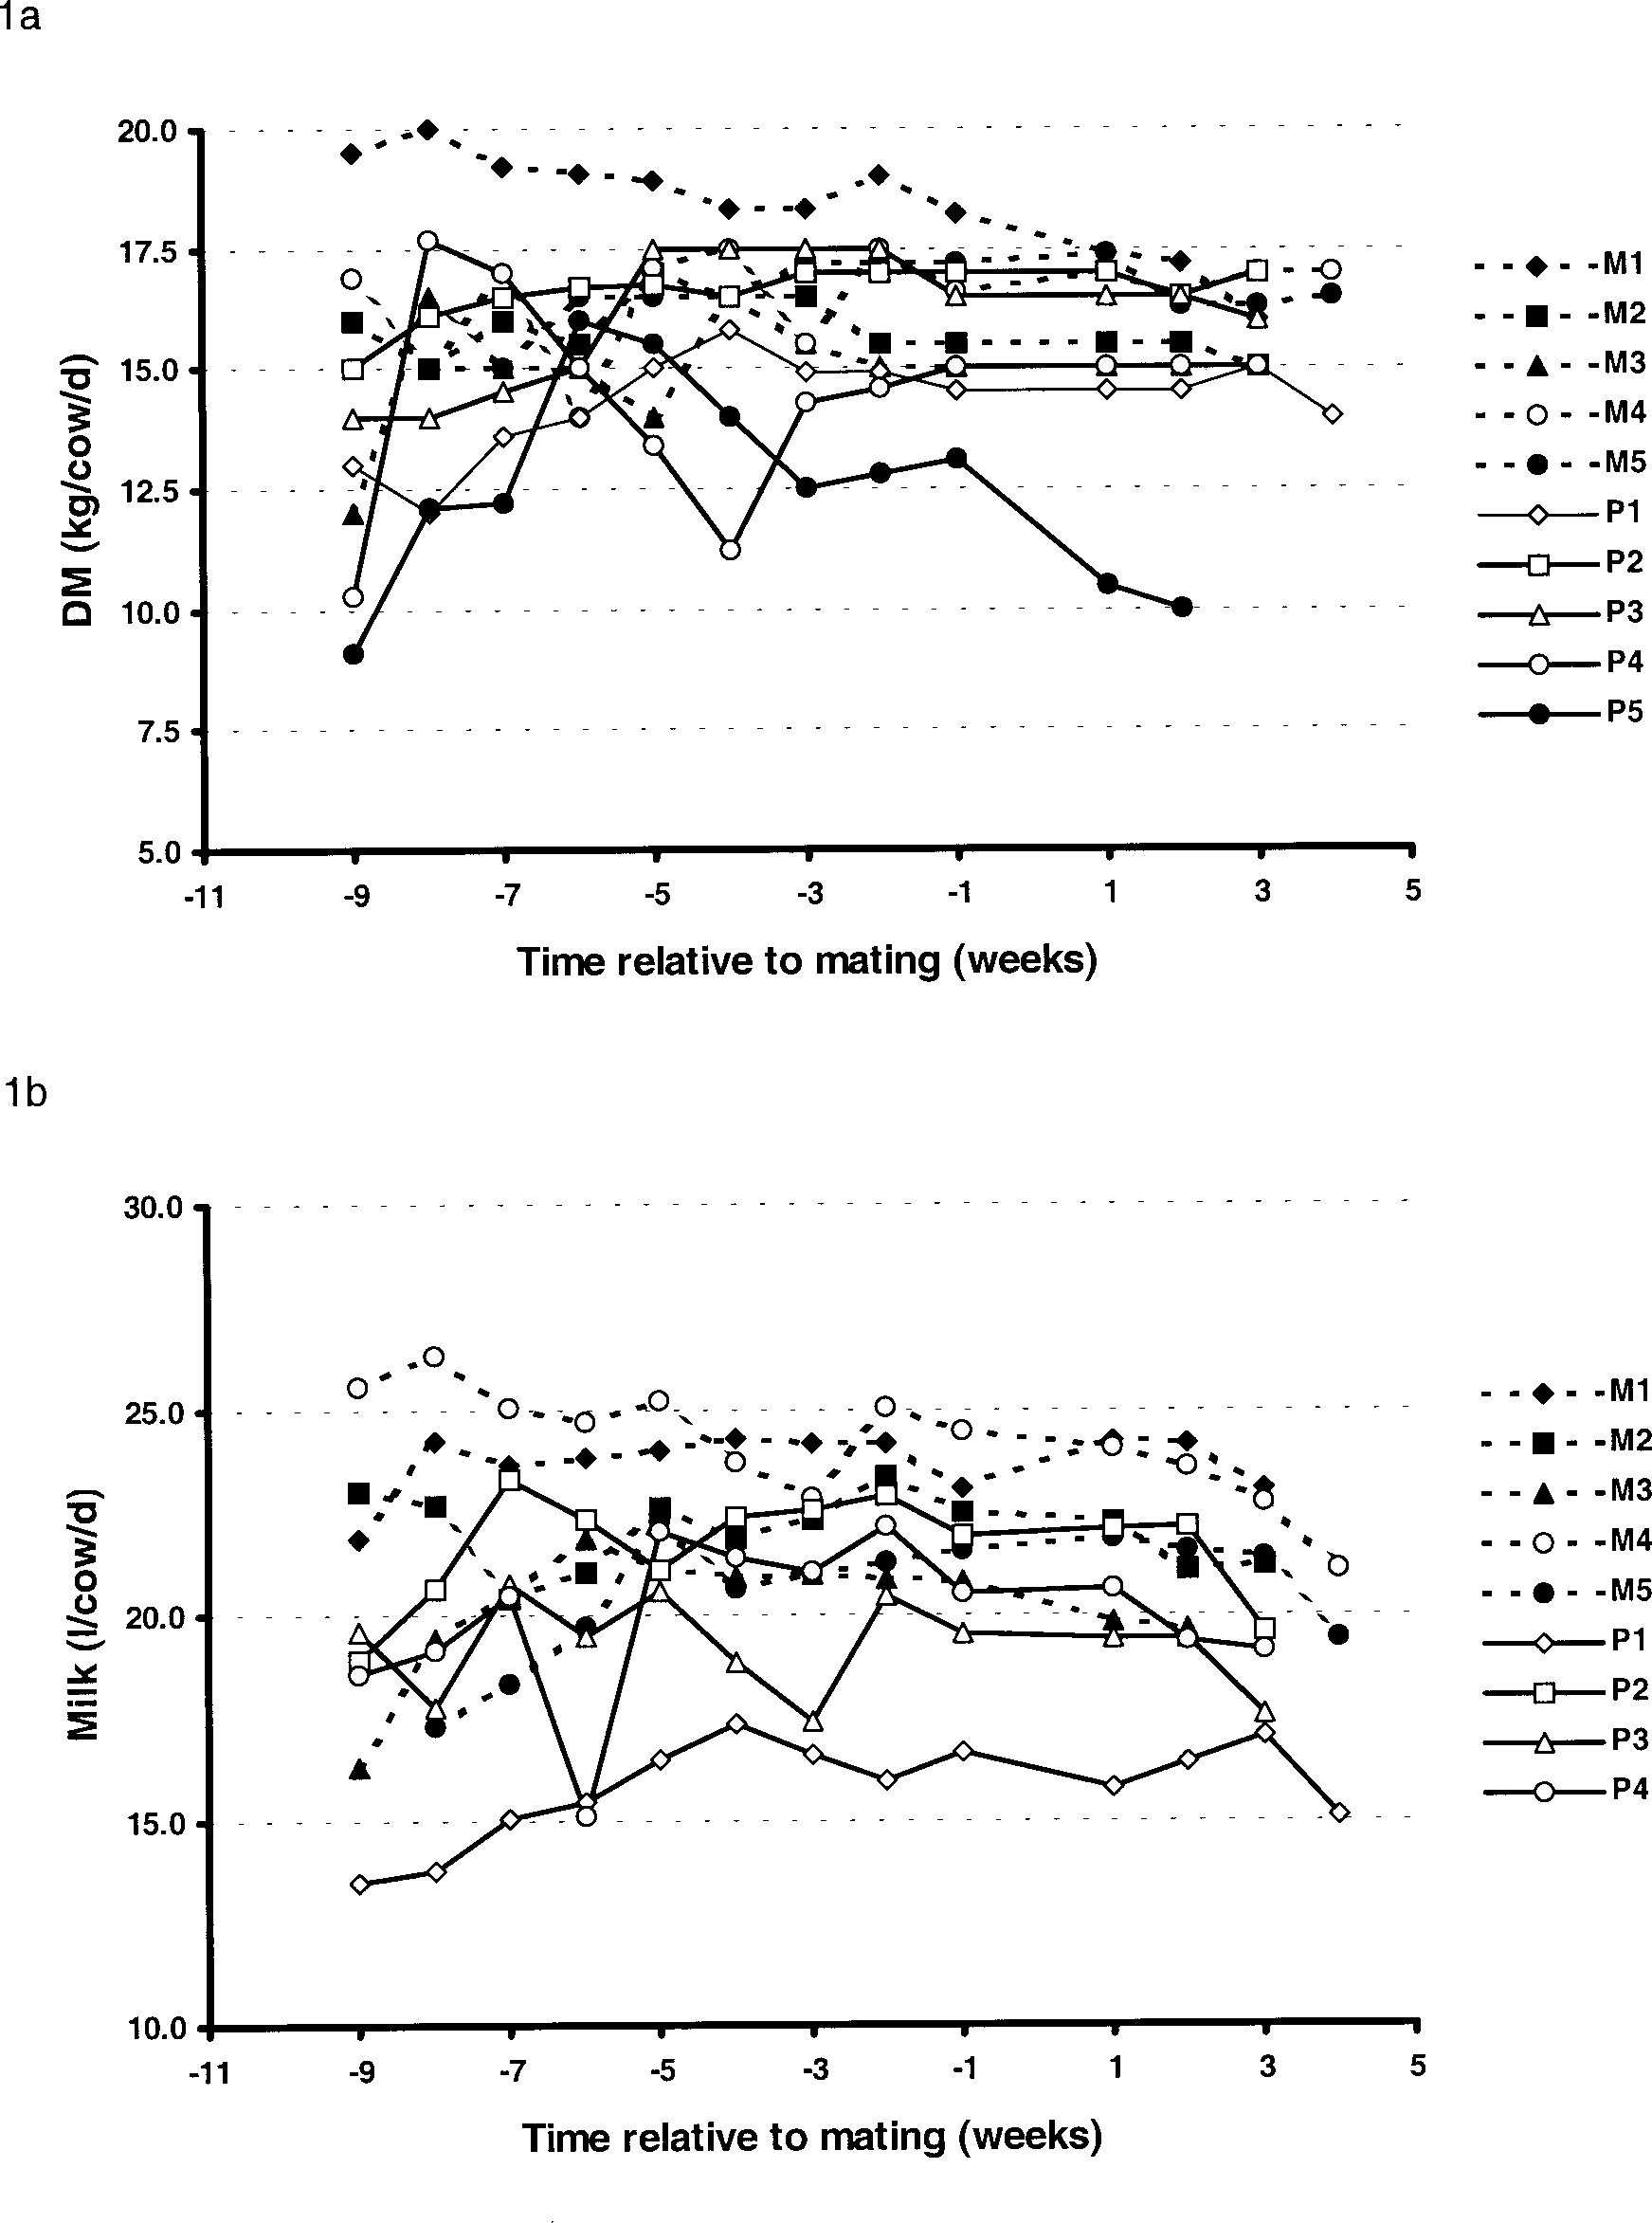
Milk production for the herds is shown in Figure 1b
method of residual maximum likelihood to model the
and the maize-supplemented farms on average had a higher
variation between and within farms. Reproductive data was
level of milk production per cow (P<0.05)
analysed using log-linear regression.
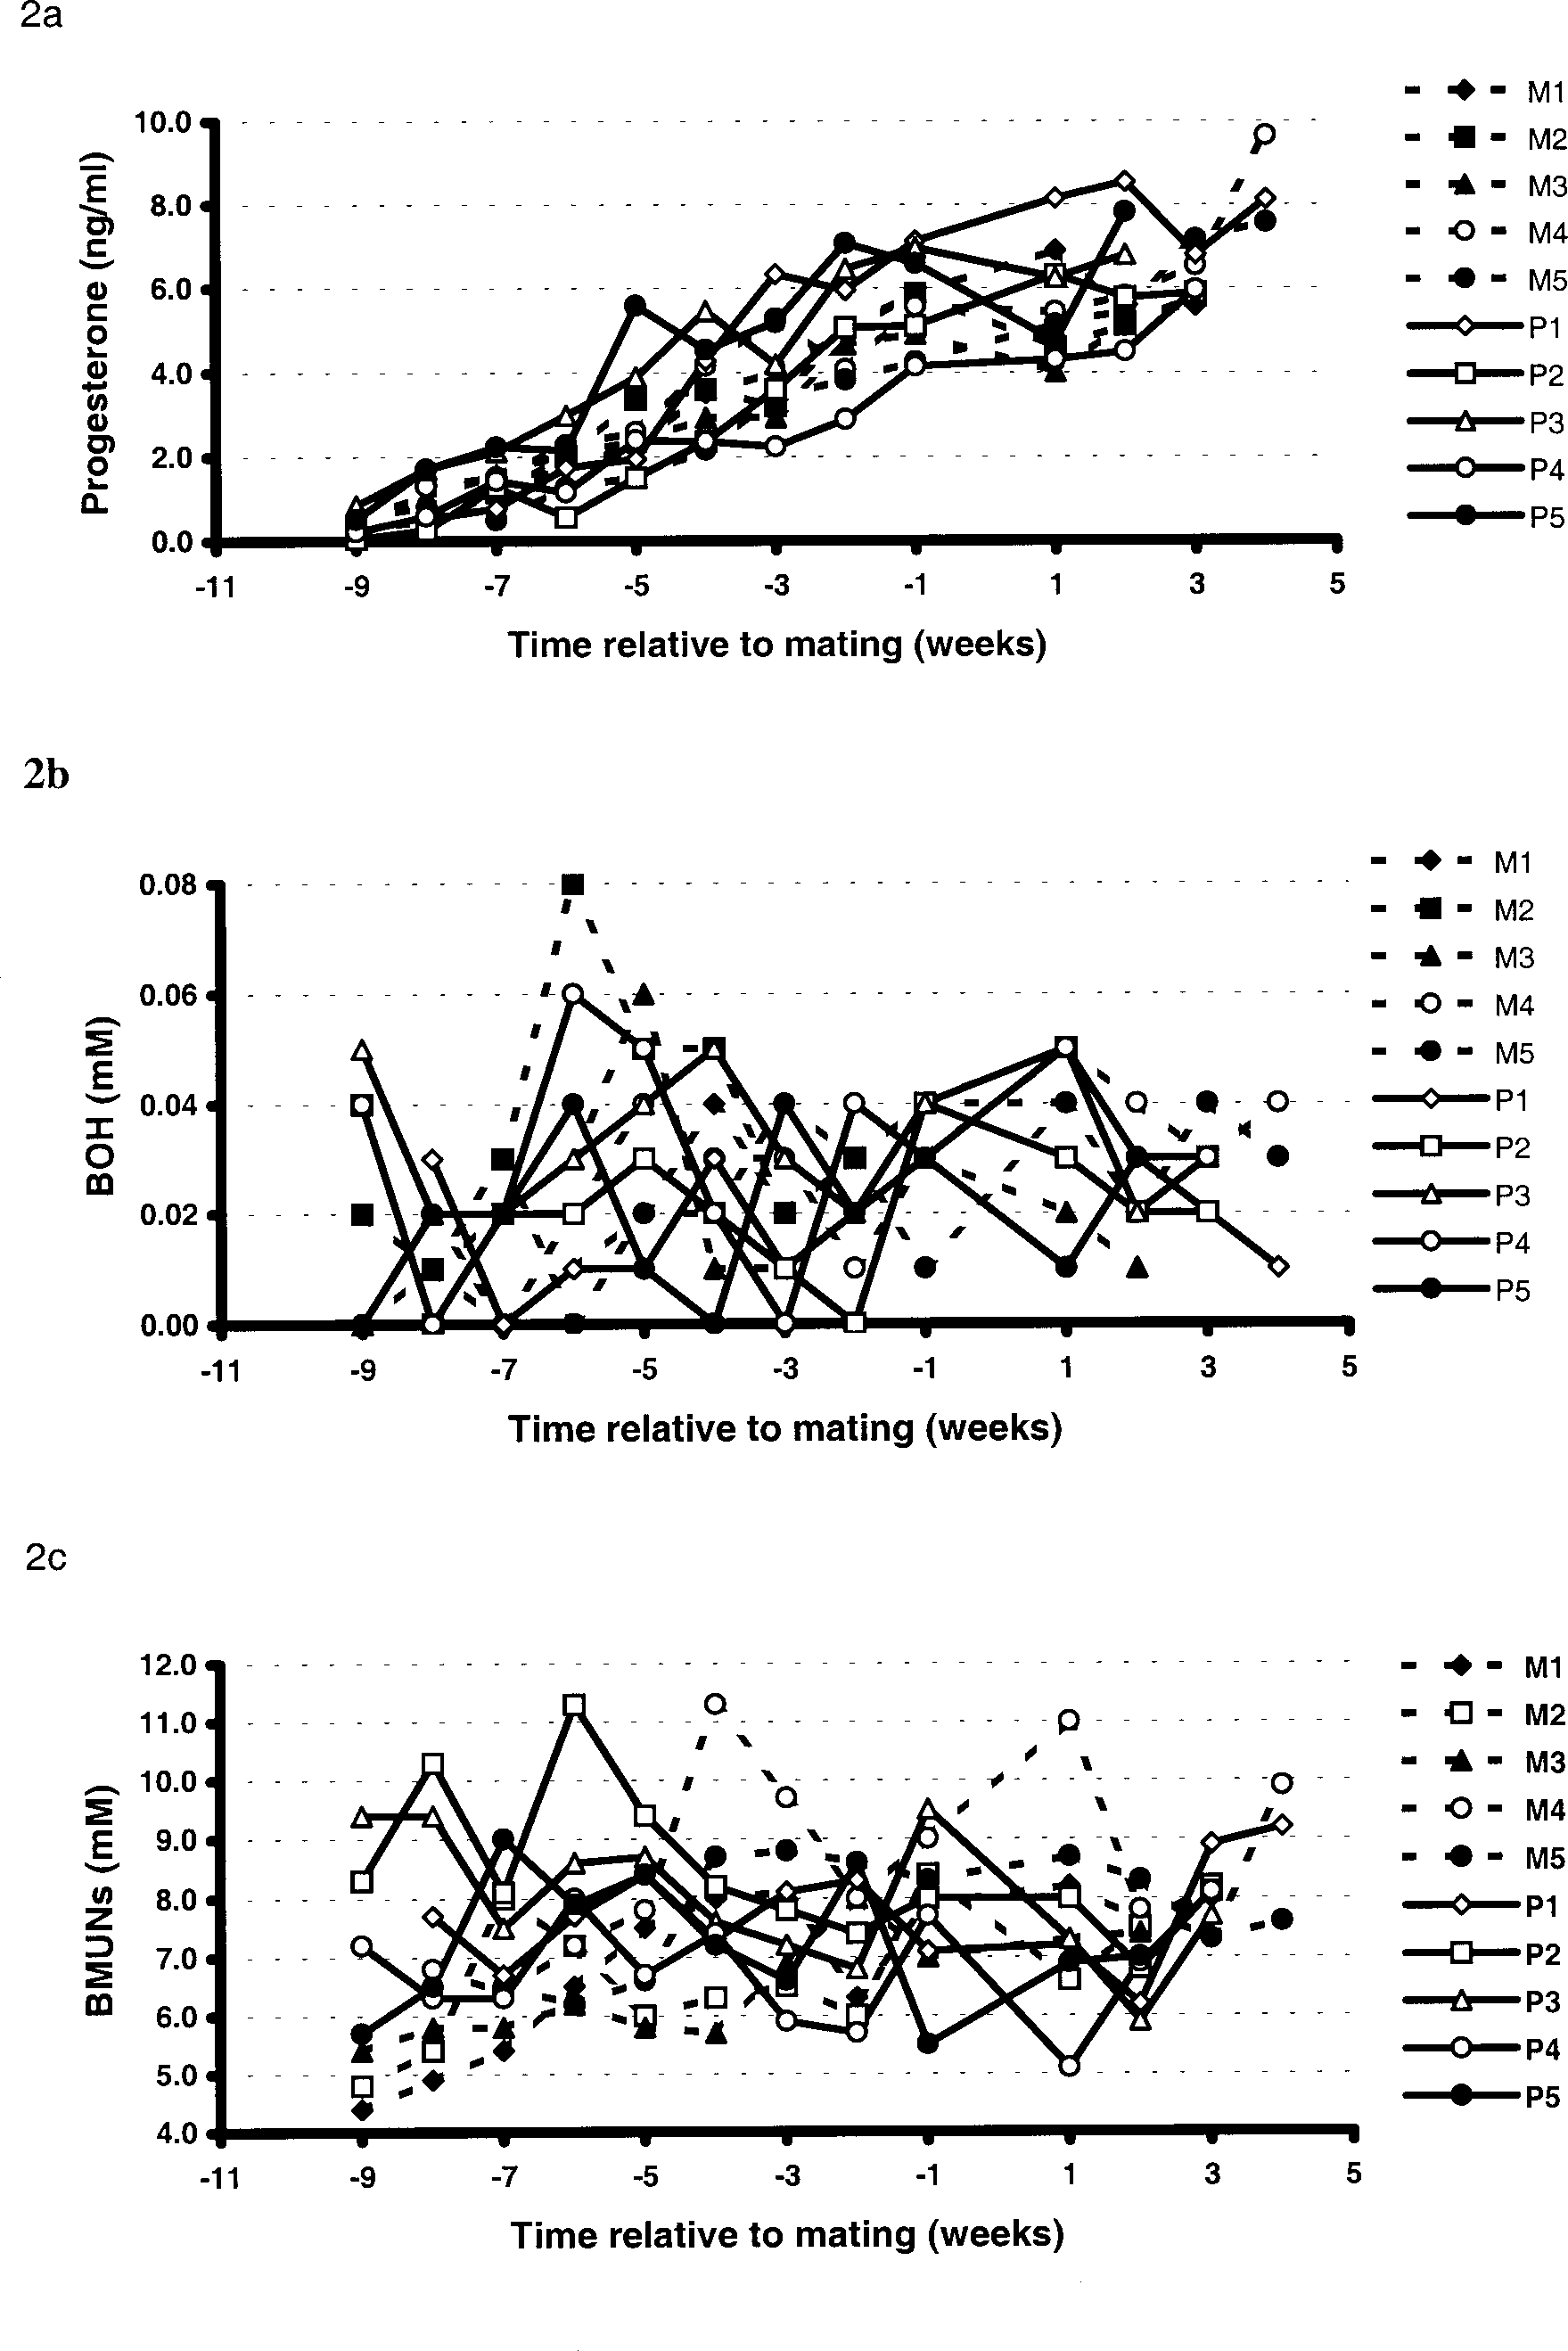
Bulk milk progesterone concentration rose linearly from
a mean of 0.5 ng/ml at 9 weeks before PSM to 5 ng/ml at
RESULTS AND DISCUSSION
PSM and to 6 ng/ml three weeks later (P<0.001; Figure
The information is presented mainly in graphical form
2a). The values at PSM ranged from 4 to 8 ng/ml between
for the individual farms and data is plotted over time relative
farms. While, the pattern of increase in bulk milk
to the planned start of mating date (PSM).
progesterone concentration tended to mimic the overall
There were significant between-farm differences in the
pattern of oestrous activity there was no relationship in the
levels of DMI, milk production, BMUN and progesterone,
ranking of farms for these parameters at any time. This
over the period from -9 weeks PSM to the fourth week of
means that bulk milk progesterone concentrations have very
mating. On average the maize-supplemented farms differed
limited diagnostic value in terms of herd reproductive
from pasture-only farms only for milk production and
There was considerable between farm variation in
reproductive performance, and this was unexpected as farms
FIGURE 2: a) Mean herd milk progesterone concentration (ng/ml); b)
were selected on the basis of their past high reproductive
Mean herd β-hydroxybutyrate (BOH) concentration (mM) and c) Meanfarm milk urea nitrogen (BMUN) concentration (mM) – relative to the
performance. There was no significant difference between
planned start of mating date. (Maize silage supplemented herds (M) in
maize-supplemented and pasture-only farms on average.
dotted lines and pasture-only herds (P) in solid lines).
There were no significant overall relationships betweenreproductive performance and the other parameters.
The weekly mean DMI (kg/cow/d) for the farms are
presented in Figure 1a and ranged from 9 to 20. There weresignificant between-farm differences and a tendency for theDMI of cows on the maize-supplemented farms to be higherthan those on the pasture-only farms but this was notsignificant. The between week variability was more marked
FIGURE 1: a) Mean farm Dry Matter Intake (kg per cow per day) and b) Mean farm Milk Production (litres per cow per day) - relative to the planned start of mating date. (Maize silage supplemented herds (M) in dotted lines and pasture-only herds (P) in solid lines).
Bulk milk BOH showed no consistent pattern over the
period of measurement and in any one week concentrationsranged between farms from 0.00 to 0.08 mM( Figure 2b).
BMUN concentration also showed little average change
over the pre-mating and mating periods with average levelsof 7.25 mM (Figure 2c). However, there was a significant(P<0.001) difference between the maize-supplemented andthe pasture-only farms in the pattern of levels over theperiod, the maize farms being significantly lower at the
Proceedings of the New Zealand Society of Animal Production 2001, Vol 61TABLE 1: Reproduction summary showing the means and sem for the proportion of the herd that were exhibiting oestrus or were pregnant at various times relative to the start of mating.
* Farm- M= pasture +maize silage supplementation, P= pasture-only; PSM = date for start of mating; %cyc= proportion of herd detected in oestrus byPSM; %P3= proportion of herd pregnant at 3 weeks of mating (similarly for %P6, %P9 and %P12).
earlier times and rising to similar levels by the start of
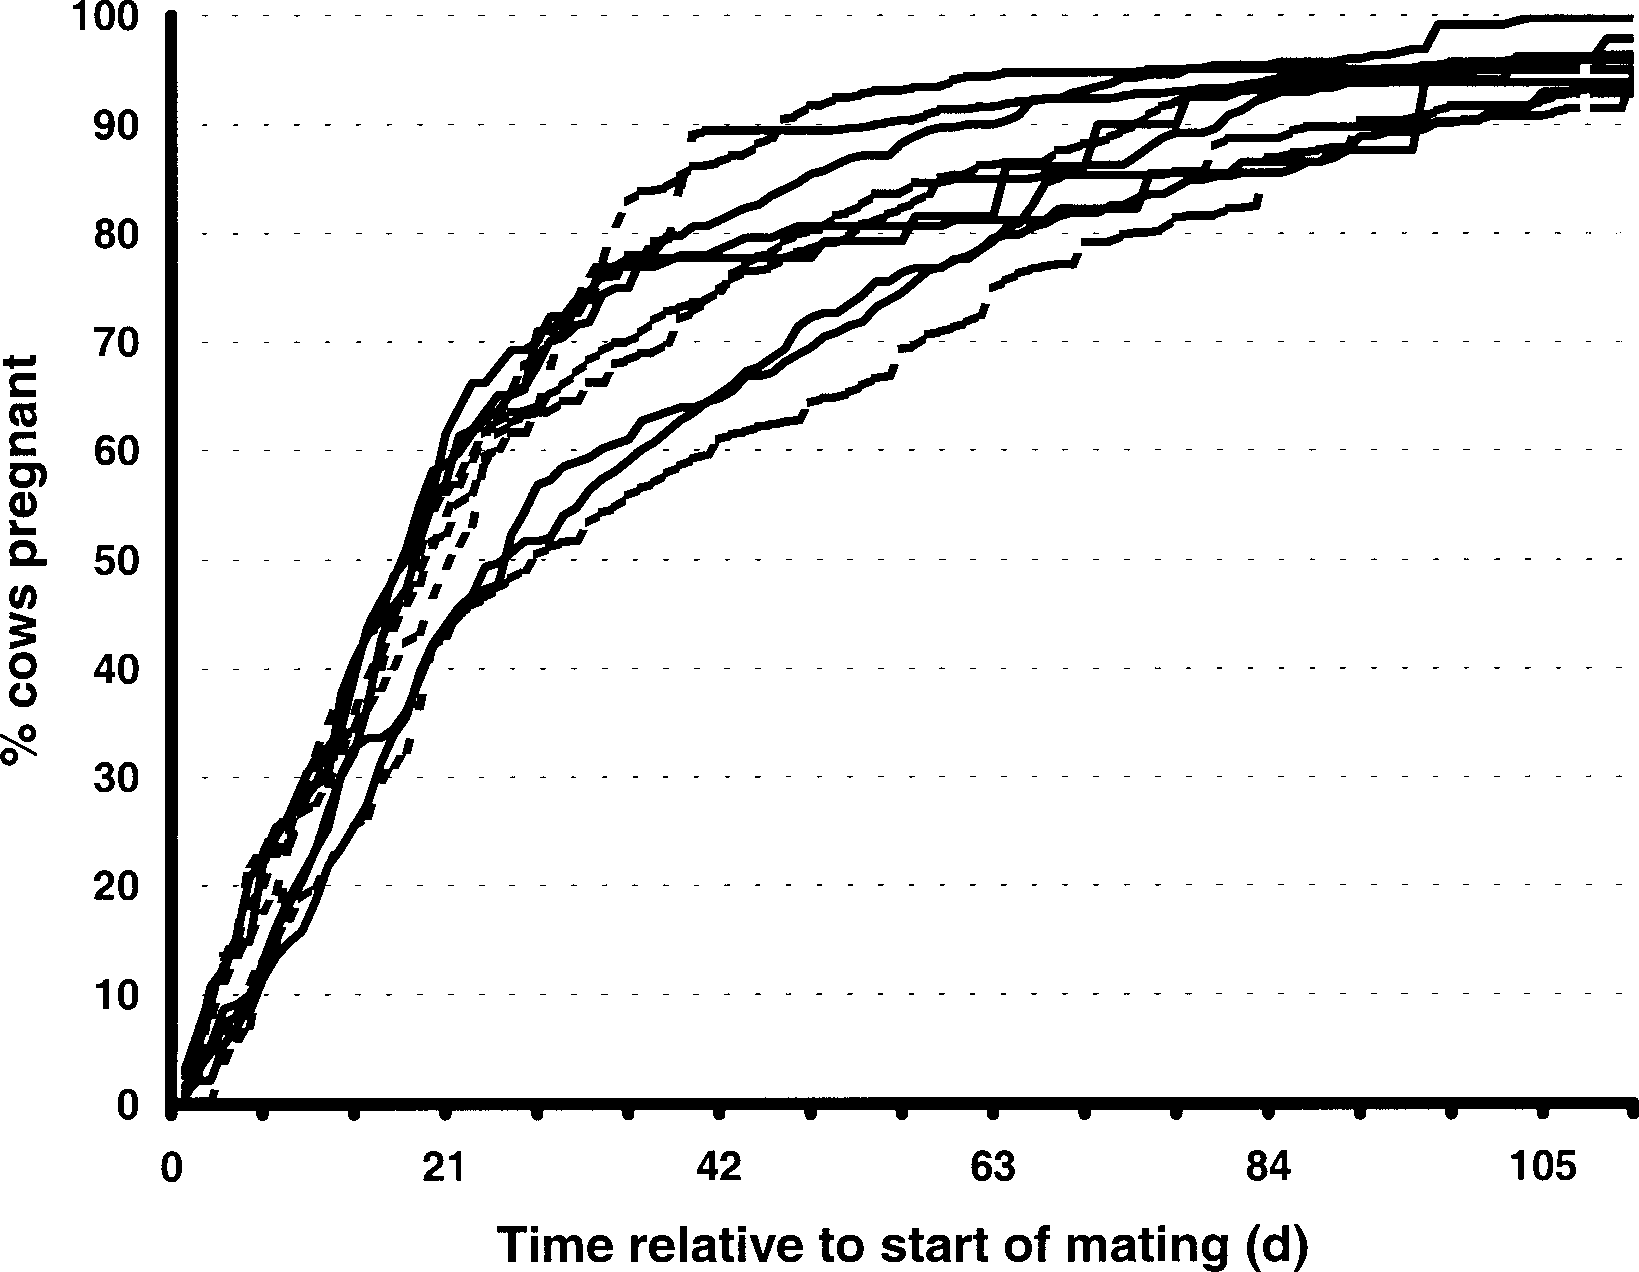
The mean proportion of cows pregnant to AI at PSM +
3 weeks (%P3) was 51.3 ± 2.1 % range 43 to 61.5%; at
The significant between-farm differences in these bulk
PSM + 6 weeks (%P6) the mean was 75.3 ± 3.3% (61 to
milk parameters did not appear to be related to reproductive
89.5%); at PSM + 9 weeks (%P9) it was 84.7 ± 2.2% (74.9
performance. Detailed examination of the type of feed
to 91.6%) and at PSM + 12 weeks (%P12) it was 91.3 ±
consumed on one farm and the changes in the BMUNs for
1.2% ( 86.5 to 95.4%). The overall pregnancy rates at the
that farm indicate that the interpretation of BMUN data
end of mating (16 weeks) were all between 93 and 96%
would be extremely difficult without detailed feed intake
(Figure 4) and this places them all in the top 20% of herds
in the North Island ( Smith et al., 2001; Xu & Burton, 2000).
The reproductive performance of the herds is
summarised in Table 1. and detailed in Figures 3 to 5. The
FIGURE 4: Distribution of conception date from the start of mating.
mean proportion of cows cycling at PSM was 65.6 ± 4.4%
(Maize silage supplemented herds in dotted lines and pasture-only herds
and ranged from 50.5 to 81% (Figure 3). Nine of the ten
herds had a submission rate to AI after three weeks ofmating, over 80 % and six of these were above 86%. Thisperformance indicates that these six herds are comparablewith the top 20% of herds in the North Island ( Smith et al.,2001; Xu & Burton, 2000). FIGURE 3: Proportion of cows cycling relative to the start of mating. (Maize silage supplemented herds in dotted lines and pasture-only herds in solid lines. Note: data available from only two of the five pasture-only herds).
Figure 5 presents the pattern for the interval from calving
to conception. While these benchmark herds are regardedas having previously had very good reproductiveperformance, only four of the nine herds had a medianconception date (50% of cows pregnant) within an 83-dayinterval of calving (the time needed to maintain a 365-daycalving interval), although for another two herds the medianinterval was 86 days. This, coupled with the conceptionrate by 21 days after start of mating (six of the ten herdsgreater than 50%), indicate that some of these herds weremeeting the expected targets. Examination of the data, onthe pattern of calving relative to the planned start of matingfor the preceding calving in theses herds, showed that in allherds over 95% of cows had calved three weeks before the
Smith et al. – BENCHMARK HERDS FOR REPRODUCTIONFIGURE 5: Distribution of interval from calving to conception. (Maize
Rhodes, F. M.; Clarke, B. A.; Nation, D. P.; Taufa, V. K., Macmillan, K.
silage supplemented herds in dotted lines and pasture-only herds in solid
L.; Day, M.L.; Day, A. M.; McDougall, S. 1998: Factors
influencing the prevalence of postpartum anoestrus in NewZealand dairy cows. . Proceedings of the New Zealand Society ofAnimal Production. 58: 79-81.
Smith, J.F.; Beaumont, S.; Hagemann, L.; McDonald, R.M.; Peterson, A.
J.; Xu, Z.Z.; Duganzich, D.M. 2001: Relationship between BulkMilk Urea Nitrogen and reproductive performance of NewZealand Dairy herds. Proceedings of the New Zealand Society ofAnimal Production. 61: 192-194
Verkerk, G.A.; Guiney, J.C. 1999: Can β-hydroxybuterate levels predict
the postpartum anoestrus interval of dairy cows. Proceedings ofthe New Zealand Society of Animal Production. 59: 205-207.
Xu, Z.Z.: Burton, L. 2000: Reproductive performance of Dairy cows in
New Zealand. Proceedings of the Australian and New Zealandcombined dairy veterinarians’ conference, Vanuatu : 23-41.
planned start of mating . This indicates that, while the
overall number of empty cows in these herds is low, in someof these herds there must be considerable culling of thecows with later conception dates and their replacement byearlier-calving heifers or the use of induction to maintainthe annual calving pattern.
One of the objectives of the New Zealand Dairy industry
is to have a “reduction in induction” but these data indicatethat even with high reproductive performance herds it willbe difficult to achieve this and still maintain a concentratedcalving pattern.
The lack of difference between the maize-supplemented
and the pasture-only herds indicate that management factorsother than post-partum feed supply are exerting effects onherd reproductive performance.
The lack of relationships between the bulk milk
measures and herd reproductive performance indicate thatthese milk measures do not provide any useful criteria forreproductive management. While the data from this projectwould restrict that conclusion to herds with highreproductive performance. A similar conclusion, in relationto the use of BMUNs, was reached using data from herdswith a much greater range in reproductive performance(Smith et al., 2001). ACKNOWLEDGEMENTS
To the participating farmers and Miranda Honcoop (Den
Bosch, The Netherlands) for on-farm data collection. NewZealand Dairy Board Global Funding supported the project
REFERENCES
Clark, B.A.; Chagas, L.M.; Gore, P.M.; Dow, B.; Verkerk, G.A. 2000:
Prediction of postpartum changes anovulatory interval in dairycows. Proceedings of the New Zealand Society of AnimalProduction. 60: 15-18.
McDougall, S. 1994: Postpartum anoestrum in the grazed New Zealand
dairy cow. Ph.D. Thesis, Massey University.
Moller, S.; Mathew, C.; Wilson, G.F. 1993: Pasture protein and soluble
carbohydrate levels in spring dairy pasture and associations withcow performance. Proceedings of the New Zealand Society ofAnimal Production. 53: 83-86.
Demographics, Practices, and Prescribing Characteristics of Physicians Who Are Early Adopters of New Drugs Harold E. Glass, PhD, and Bruce Rosenthal, MBA ABSTRACT portant factors in influencing doctors’ adoption of a new drug,We conducted an analysis to determine the factors thateven if physicians sometimes minimize the importance theyinfluence physicians’ decisions to
Arenz , S., H. J. Schmitt, A. Tischer and R. von Kries (2005). Effectiveness of measles vaccination after household exposure during a measles outbreak: a household contact study in Coburg, Bavaria. Pediatr Infect Dis J. 24 (8): 697. Bartling, B., H. S. Hofmann, T. Boettger, G. Hansen, S. Burdach , R. E. Silber and A. Simm (2005). Comparative application of antibody and gene array for exp
 Smith et al. – BENCHMARK HERDS FOR REPRODUCTION
Data Analysis
Smith et al. – BENCHMARK HERDS FOR REPRODUCTION
Data Analysis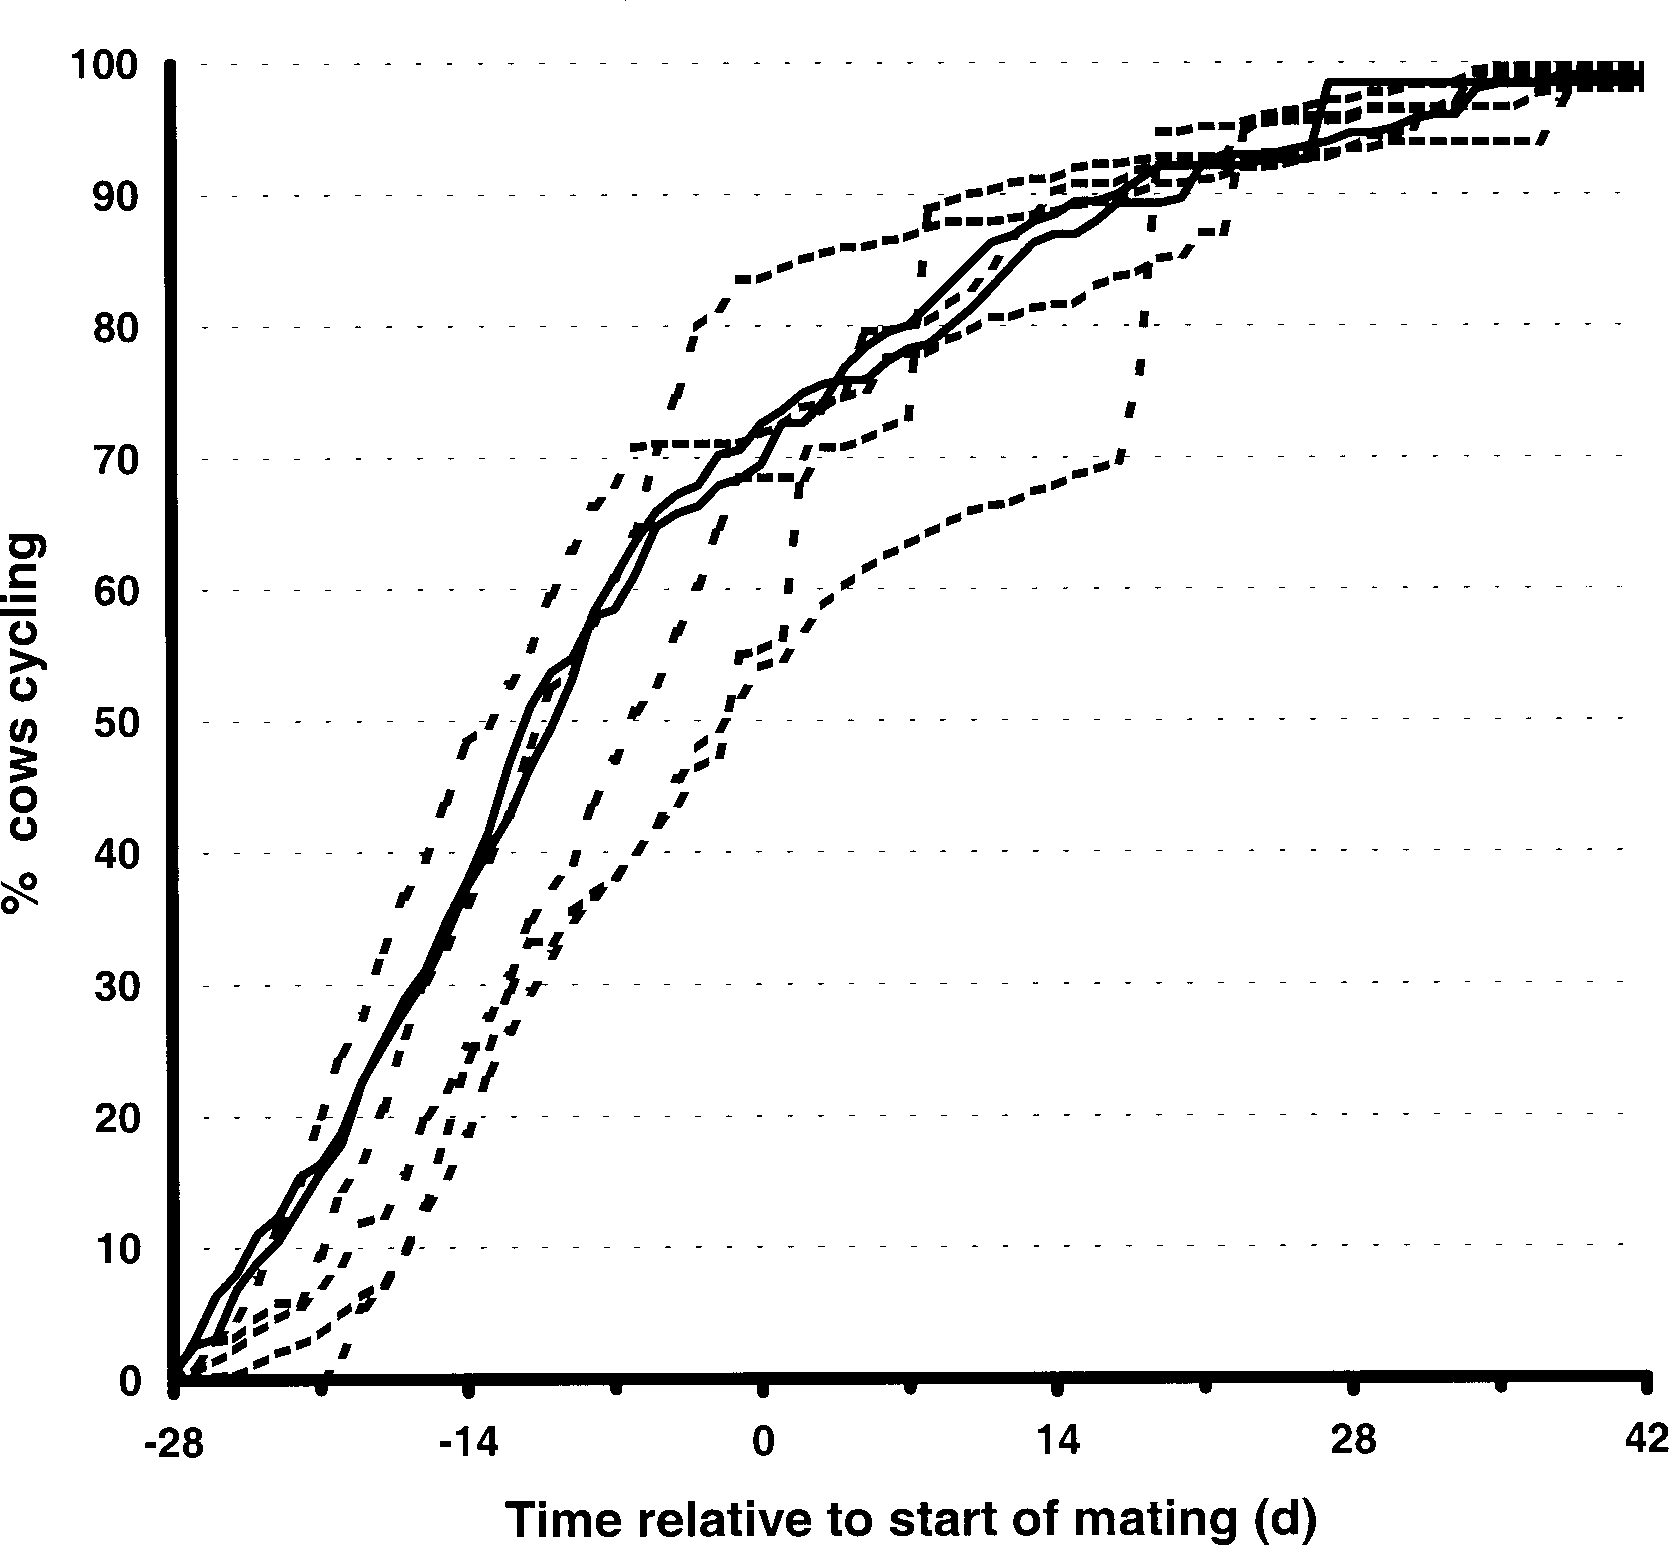
 Proceedings of the New Zealand Society of Animal Production 2001, Vol 61
TABLE 1: Reproduction summary showing the means and sem for the proportion of the herd that were exhibiting oestrus or were pregnant at various
Proceedings of the New Zealand Society of Animal Production 2001, Vol 61
TABLE 1: Reproduction summary showing the means and sem for the proportion of the herd that were exhibiting oestrus or were pregnant at various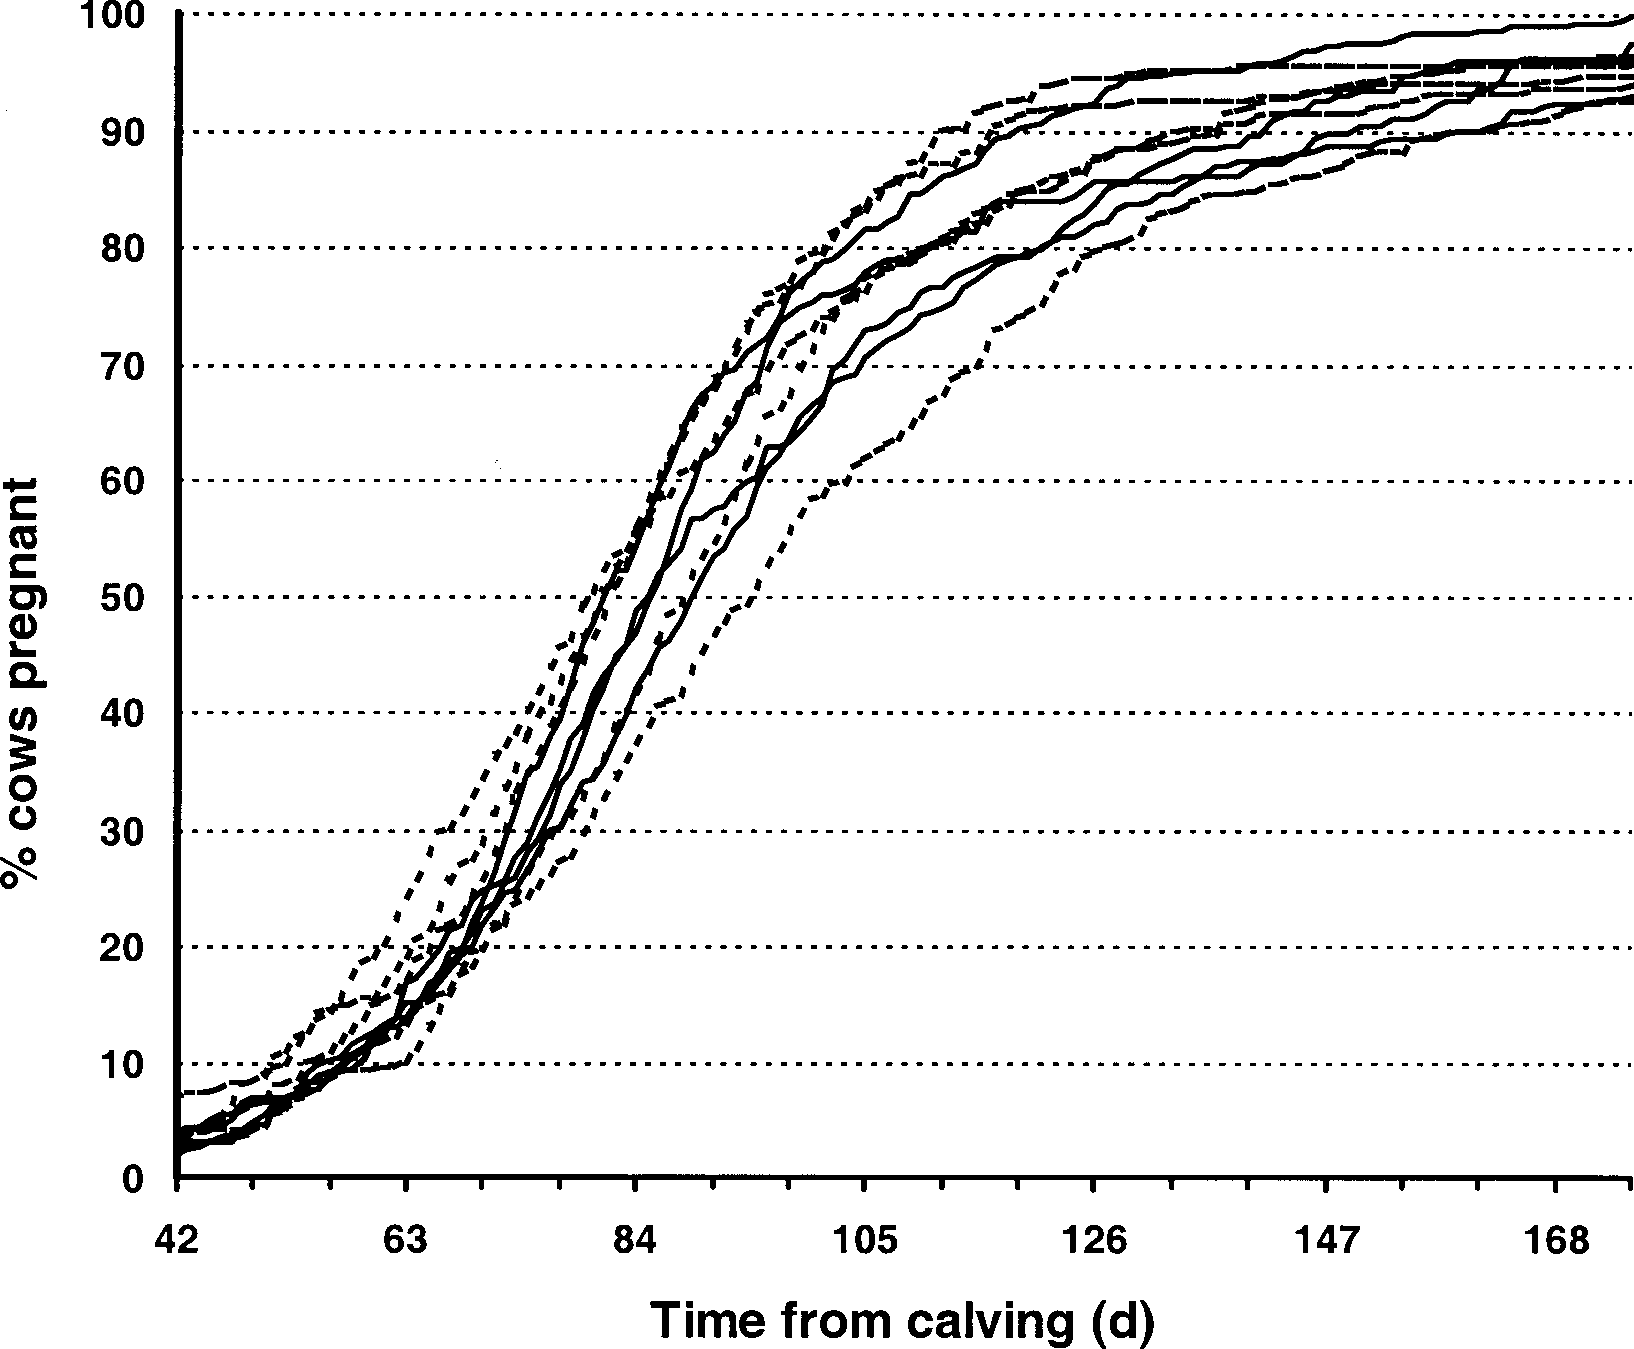 Smith et al. – BENCHMARK HERDS FOR REPRODUCTION
FIGURE 5: Distribution of interval from calving to conception. (Maize
Smith et al. – BENCHMARK HERDS FOR REPRODUCTION
FIGURE 5: Distribution of interval from calving to conception. (Maize