Magnetic Fields of Biological Objects
number of leads from the sleeping subject and the use of one-channelinstrument.
MEG and EEC recording in the delta-rhythm band is difficult
because artefacts related to signals from the heart were elicited exactly inthis band. The use of high spatial resolution magnetometer showed noMEG and EEG correlation in that band [85].
Magnetic signals in the beta- and gamma-frequency bands can
hardly be distinguished from noise at the normal state. They becomedetectable at the 23-25 Hz frequencies following the use of tranquilizers bythe patients [85]. Similarly to EEG of the same frequency range MEGs arefound to be more pronounced in frontal areas. Apparently, improvedtechniques of the measuring system noise reduction will promote detailedstudies of these rhythms.
Magnetic mu-rhythm was detected from a subject engaged in motor
activity such as making a fist by the hand ipsilateral or contralateral to theleft hemisphere. Contraction of the hand on the contralateral arm caused2.5-fold attenuation of the signal amplitude at 8 Hz while contraction of theipsilateral hand entailed no appreciable effect. This is the basic informationon the main MEG rhythms.
Having adjusted the SQUID based biomagnetic system we
performed direct MEG recording from the subject with eyes opened andclosed. All experiments were staged in a room on the fifth floor of ourinstitute at maximal distance to sources of possible industrial interference. The obtained results are presented in Fig. 25 showing that MEG is similarto EEG and changes on opening and closing of the eyes.
MEG and EEG data processing in "Labtam" computer revealed a
pronounced peak in the alpha-rhythm band (10 Hz) in the MEG spectrum atthe eyes closed. Verification test performed without the subject revealed nosuch peak (Fig. 26).
Preliminary mapping of MEGs was done on the basis of data from
three subjects. MEG spectra in the alpha-band had more frequencycomponents than EEC spectra. Presence of certain spectral components wasrelated to the system of MEG leads. Mapped distribution of averageamplitude of the main peak was used to identify two limited areas featuring0.3-0.8 pT maximal average amplitude. The maps also indicated that alpha-activity on MEGs was recorded only from the occipital and parietal areas.
It was not traced in the temporal and frontal areas.
Secondary mapping of MEGs of the same subjects one month later
showed that the basic spectra configurations and spatial distribution of theMEG average amplitudes remained the same.
Varying phase relationship between MEG and EEG from the same
lead supported the assumption that they reflected the function ofsynchronously operating sources localized in different areas, or of the samesources producing different frequency components. The situation wasclarified by detailed analysis of the extremums location on MEG and EEGmaps for two subranges of the alpha-rhythm: low- and high frequency.
Foci of alpha activity of MEG maps were identified in 11 subjects
from the group of 13 (number of MEG leads from 60 to 150). Theremaining two appeared to have no such foci. A complex pattern of MFfoci distribution was characteristic of all the 11 subjects. MEG extremumswere detected only in the parieto-occipital area while the activity in thefrontal and central areas was at the noise level.
Field extremums were symmetrical relative to the sagittal line with
the accuracy up to 5 mm in 9 subjects. Mirror-like field symmetry wasdetected in 6 subjects. Except for one case, there were found no extremumsabove the sagittal line on maps. The MEG amplitude in both hemisphereswas more or less similar in 9 subjects. The left hemisphere was dominatingin one and the right in another subject.
Preliminary localization of sources by low- and high frequency
components of the alpha activity on MEGs was performed for all subjects. Calcarine fissure and temporal parieto-occipital areas (TPA) were found tobe the most frequent locations of the alpha activity generator on MEGs.
Coinciding positions of extremums on MF maps drawn for two
independently selected alpha-rhythm subranges supported the assumptionthat one and the same source of MEG can generate alpha-rhythms ofdifferent frequencies.
Relative covariance (RC) rates were estimated for subjects of the
first group and used to draw isocovariance maps in order to detectcorrelation of the MEGs and EEGs recorded simultaneously from the samesource. Two extremums of RC with opposite polarity were detected in onegroup of
Magnetic Fields of Biological Objects
subjects over each hemisphere. Positions of extremums on the MEGamplitude and isocovariance maps coincided. Isocovariance maps drawnfor other subjects pointed out to possibility of having one extremum of RCin each hemisphere.
All subjects were classified into three subgroups by level of alpha-
activity on MEG as follows: a) extremums of MF occurred mostly inoccipital leads, b) in parietal leads, c) mixed group.
Analyzing the spatial distribution of MF foci with due account of
sensitivity of MF maps to the interhemispheric fissure (symmetric positionof foci and pattern of isomagnetic lines relative to the sagittal head line) itmay be assumed that the abovementioned positions of MF extremums areprimarily related to individual anatomic features of cerebral cortex in theparietal and occipital aress.
Assuming that loci of visual field cortex are the sources of alpha-
rhythm, the interindividual variability of foci on MEG maps may beattributed to individual geometry of fissures and gyri and to cortex fieldsdistribution on them.
Lack of extremums on MEGs of the central and frontal areas in all
—sources creating the frontal focus of alpha-rhythm on EEG are
— no powerful alpha-rhythm sources exist in the frontal and
The calcarine fissure may be the most likely source creating such
configurations of MEG and EEG foci. Its raster slope could be the sourceof the frontal EEG focus evoked by physical induction. The similarorientation of single generators (towards the precentral and frontal regions)is facilitated by position of parietal-occipital sulcus over which smallamplitude foci are detected from the parietal MEG leads.
How can this line of thought be harmonized with the known
regularity of phase relations between occipital and frontal EEG leads? Astudy of the dynamics of isopotential maps was carried out to answer thisquestion.
Studied were isopotential maps drawn at 5 ms intervals (instant
mapping) of a 16-channel EEG in the alpha-rhythm band. The example ofmapping one spindle of the alpha-rhythm oscillation on a high timeresolution EEG demonstrates that the spatial configuration of EEG field
basically repeated its pattern on the two neighboring maps without anyleap-like changes. It was changing most smoothly in occipital regions. Thepattern of isopotential lines and configuration of foci were repeated onmaps of the first 50 ms and the second 50 ms of the oscillation (onlypolarity changed while the field topography remained identical). In contrastto the frontal, the occipital foci did not change their position althoughpolarity changed in both. There was also observed the regular motion of thezero isopotential line. Passing through TPA it was slightly bent down, gotbroken in the middle (25 ms) and turned (50 ms) as if rotated clockwise (inthe right hemisphere). The same motion repeated in 50 ms.
Detected regularities in phase and topographic correlations of foci
for one alpha-rhythm oscillation may be attributed to the joint action of thedifferently oriented dipole-like generators in TPA synchronously activatedin groups with regular phase delay.
Dynamic examination of color isopotential maps with 'Pericolor-
2000' computer revealed at least one focus of alpha activity in TPA of eachhemisphere in 8 subjects. Each focus was formed by rotation of the zeroisopotential line around one of its points on TPA which could be observedvisually as circular motion of spiral waves and slight migration of theirrotation center.
The presented radial or spiral scanning has its rotation center which
may point out to the original source of alpha-rhythm generation on EEG incontrast to merely describing a single circular EEG wave process whichmakes identification of its start unrealistic. Locating centers of radialscanning in TPA may support the hypothesis that the scanning mechanismparticipates in the regular distribution of excitation cycles in the remoteisolated cortex sensory parts. The process involves the sensory fluxquantization in the alpha-rhythm frequency. Thus, positions of MEG andEEG alpha-rhythm extremums in the spatial and time mapping may beattributed to function of the most powerful differently oriented sources ofthe rhythm in the region of calcarine fissures of the both hemispheres, andof tangential sources in TPA and parietal-occipital sulcus in case of severalEEG fragments. Magnetic Fields of Biological ObjectsSPONTANEOUS MAGNETIC ACTIVITY OF SICK BRAIN
MEG of spontaneous magnetic activity was recorded from subjects
suffering from some diseases of the nervous system.
The first MEG from a patient suffering from psychomotor epilepsy
was recorded by D. Cohen in 1972. A few seconds after the beginning ofextended hyperventilation high amplitude delta-waves appeared on MEG. The simultaneously recorded EEG showed mixed delta- and theta-activityin three leads.
Studies of MEGs and EEGs of ten patients suffering from various
neurological problems (brain tumor, depression, migraine, behavioraldisorders, generalized epilepsy with bilateral synchronous 3 Hz peak-wavecomplexes of EEG) indicated that the following types of activity wereshown on MEG better than on EEG: single slow waves related to tumor;alpha-activity in patients with diffused delta-rhythm; harmonic componentsof the 3 Hz peak-wave complexes.
Examination of 80 patients suffering from a wide range of brain
diseases such as generalized and focal epilepsy many of which appeared tobe secondary to the identified brain pathologies (cicatrices, atrophies,tumors, angiomas, calcifications, etc.) revealed increased magnetic activityin the frequency bands where it is normally low (0.5-8 Hz and 13-22 Hz). Strong correlation between pathology and signal amplitude variability wastraced.
There was detected a limited region on the head over which the
"peak-wave" complex was recorded. This could be attributed to possibleorientation of the current evoking the detectable MF.
Since it was discovered that the peak component is reflected on
MEG stronger than the wave component the authors were inclined toassume that the "peak-wave" complex is elicited by different sources.
Examination of 15 patients treated for focal epilepsy
(frontotemporal, rolandic, dextroocipital, anterotemporal) indicated thatMEGs could be successfully used in all cases of the Jackson epilepsy tolocalize pathologic activity even when it was missing from EEG or noabnormality was detected with the X-ray tomograph scanning. The authors[84] detected the spike activity on MEG which was missing from the EEG.
Spike discharges were traced on MEG and EEG at slow waves. Shifting theMEG sensor at a distance of 3 cm allowed to distinquish areas of epilepticdischarges and delta-activity. Theta-activity on MEG which was missingfrom the EEG was detected in a patient with dextrotemporal glioma twoweeks after the operation.
Comparison of traditional techniques used to search for epileptic
foci (EEG, computer tomography, etc.) with MEG-research indicated thatthe accuracy of the latter is related to focus location.
Attributing this regularity to distortions related to nonsphericity of
the scull the authors [84] used the "local sphericity" technique and reducedthe magnetic mapping error. They used a four-channel magnetometer andthe system of optical homing of sensor to the MEG lead point to detect a"border"bet-ween the activity related to the damaged brain area (delta-andtheta-waves) and the epileptic focus proper (spikes, peaked waves, etc.).
Examination of 8 focal epilepsy cases with the new system
confirmed that MEG shows a multifocus pattern which cannot be traced onEEG. Therefore, the authors found more similarity between tomographictest and MEG in terms of focus localization than with EEG.
We studied MEGs of two groups of patients. Group 1 consisted of
patients of both sexes aged 16-29 years old with preliminary diagnosis of"generalized epilepsy" (2 subjects) and 'focal epilepsy' (3 subjects). Group2 consisted of 8 children aged 10-15 years old with epileptic syndrome ofperinatal genesis. In the course of the tests all patients were under the careof medical doctors (the Burdenko Institute of Neurosurgery of the USSRAcademy of Sciences, Psychiatric Clinic of the Moscow First MedicalInstitute, Department of Clinical Psychoneuro-logy of the Moscow Instituteof Scientific Research in Pediatrics and Infant Surgery of the RSFSRMinistry of Health) [48].
The study may be exemplified by the following case. One of the patients, A.I., 20 years old, suffered from recurrent
weakness and numbness of the left arm (Jacksonian epilepsy). EEGrecorded from parietotemporal leads from the both sides showed easilyrecognizable paroxysmal "peak-slow wave" complexes having 3 sfrequency and
Magnetic Fields of Biological Objects
300 mcV amplitude. Peak-wave complexes on MEG were averaged in 50points above the right and 25 points above the left hemisphere in theparietal region using the "peak-slow wave" complex on EEG in C4—T4and C3—T3 leads as a starting signal for the right and left hemispherecorrespondingly. Measurements ofMF amplitudes of 50, 100 and 200 mstime components were used to draw MEG maps for each component. Twopairs ofextremums with opposite polarity were detected for the 50 mscomponent in the right hemisphere indicating entry and exit points of linesof force and consequently the direction of the two dipole sources whichwere believed to be oriented towards the vertex. The two dipoles for the100 ms component were oriented in the opposite direction although theirlocation was the same. Only two extremums of opposite polarity weredetected above the left hemisphere in points identically symmetrical to thepoints in the right hemisphere. The MF amplitude in these points was foundto be two times less than in the symmetrical points above the right temple. RC test showed that foci in the right and left hemisphere functionedindependently. Symmetric sources in the two hemispheres were localized inthe region of the posterior central gyrus at the 3.2 and 3.1 cm depth underthe scalp in the right and left hemisphere correspondingly. The 100 mscomponents source was localized in the point 3.0 cm behind and 2.2 cmabove the right external acoustic canal at the 4.7. cm depth beneath thescalp.
Limited areas (not coinciding with the alpha-rhythm foci) of
maximal theta-waves activity on MEG were detected on the head surface ofall patients in group 1. The picture of the cortex sources distributionresponsible for the maximal contribution into the MEG signal was drawnby selecting the most information intensive technique of signal processingin each individual case.
The epileptic syndrome in all children (group 2) was described by
polymorphic paroxysms without specific modifications of the personality. The case histories contained evidence of perinatal problems. No evidenceof focal neurological symptoms, considerable arrest of static-motor andpsycho-speech development was detected. The neuropsychologicexamination performed by E. Simernitskaya and T. Osipenko according tothe general
method adapted to infants involving evaluation of praxis, gnosis, speech,memory and thinking aimed at defining topics of interhemisphericdisfunctions and deficiency of interhemispheric interaction. The study ofobtained MEG amplitude maps revealed prevalence of the high amplitudedelta- and theta-activity in the region of temporal lobes of the brain on theright side in 5 cases and on the left in 2 cases. Similar but less pronouncedmodifications were traced as a rule in the other hemisphere symmetricallyto the main source. Apparently, the both sources should be regarded asmirror-type foci. In 3 cases symmetrical patterns of the right and lefthemisphere coincided with accuracy of up to 3 mm. The coincidence couldbe also traced in the foci topics and quantity.
MEG tests were performed on another case, patient N.G., at the
interval of several months when full remission has been accomplished. Thesecond MEG map showed leveling of the main source although thesymmetrical source has become more visible against the new background. The topical classification of fine symptoms of the brain disfunctionsdetected with the neuropsy-chological method corresponded to MEGlocalization in all patients. Keeping in mind that all examinations of thisgroup were performed with dual blind verification, coincidence oflocalization results obtained by various researchers and by differentmethods supports the combined use ofneuropsychological examination andmagnetographic mapping to correlate disfunction and precise localizationof the damaged area.
Thus, MEG is a promising technique of clinical research offering
considerable potential not only for tumoral and epilepsy cases but also forparkinsonism, alcoholic and narcotic poisoning. EVOKED MAGNETIC ACTIVITY OF THE BRAIN
Evoked magnetic field (EMF) is presently the most popular means
used to detect sources of brain activity as it reflects response of certainstructures of the brain to an adequate stimulus registered as MFmodification. There were applied sensory stimuli widely used inelectrophysiology such as visual, auditory and tactile. EMF was recordedsimultaneously with evoked
Magnetic Fields of Biological Objects
electric potential (EP). EMF to light Hash was first detected by D. Cohen(1975). Response to a more complex visual stimulus was recorded byBrenner et al, 1975 [90]; Reite et al, 1978 [135] and Williamson et al, 1981[147] and others.
Establishment of the laboratory on neuromagnetism as a result of
cooperative effort by members of thedepartments of physics and psychology of theNew York V University is a good exampleinterdisciplinary research in the field ofbiomagnetism. Workers of the laboratory,among which S. Williamson appears to be
Fig. 27. Evoked magnetic response (a) andsimultaneously recorded evoked potential (b), lead 0
one of the active, began to publish original reports in 1975 and reviews in1977. Tests appears to be were staged in an unshielded room with agradiometric system of SQUIDs in a city lab. There were primarilyanalyzed visually and sensormotorly evoked magnetic fields [132].
It was found that EMF is described by a much more correct
localization around areas of the brain corresponding to the stimulus than theEP localization. While EMFs in visual regions of the both hemisphereswere in the opposite phase, EP modifications were in phase (Fig. 27).
EMF amplitude appears to be still increasing with the stimuli
intensity growth when EP amplitude ceases to grow.
EMF latency is a constant value describing properties of the visual
system. It is unrelated to the stimulus duration. In contrast to EP, EMF doesnot fall with the stimulus increase. In some subjects there was detectedcertain difference between EMF of different hemispheres which could notbe traced in the course of EP registration.
Since 1980 researchers [143] began to present information on EMF
studies on maps showing distribution of the detected MF amplitudes andvectors. These maps may be used for easy localization of the electric sourcein the brain. Dipole's depth may be calculated by dividing the distancebetween the two maximal values of EMF of the opposite polarity by 2. The
depth of the dipole may be estimated by drawing the zero EMF line on thescull dividing EMFs of different polarity.
Visual EMF mapping supported the conclusion that the electric
source of the primary components of responses is located in the visualcortex fissure. As it is believed that cortex of the cerebral hemispheres hascolumnar structure and modern magnetometers can measure only thetangential currents relative to the scull's surface, the signal may be elicited,as it logically stems from the above, only above the fissure. It is assumedthat the dipole is located at the 2.1 cm depth. Therefore, the spatialpotential of magnetometry is quite important to evaluation of sensoryfunctions of the cerebral cortex.
The first report on auditory EMF registration was published in
1978 in the USA [135]. It was detected above the Sylvian fissure byrepeating sound clicks at 0.25 s intervals and summing up 512 realizations. The average auditory EMF amplitude was 0.4 pT. There was developed asource model comprised of the two vertically oriented current dipoleslocated on the both sides of the longitudinal fissure 3 cm deep inside thetemporal lobes.
Hari et al. [117] detected auditory EMF to the I Hz 800 ms
monoaural stimulation with a plastic tube. Responses were elicited in thebeginning and end of the stimulation [77].
Danish researchers [107] also applied the same sound lasting 500
ms. Maximal amplitudes for the EMF were 0.5 pT for 100 ms latency and0.3 pT for 180 ms latency.
Subsequently there were published many reports on the detailed
study of auditory EMF aimed at drawing a tonotopic map of the humancerebral cortex.
There was even detected the auditory EMF from the 7.5 month
human embryo still in the womb [89].
Somatic EMF elicited by weak electric stimulation of various parts
of human extremities were first studied in the laboratory ofneuromagnetism of the New York University. EMFs were localized closeto the Rolandic fissure in the hemisphere opposite to the stimulated finger. It was reported that the current dipole activated by the little fingerstimulation is located 2 cm above the dipole activated by stimulation of thethumb.
It appears that the EMF method may produce maps of the so-
matosensory projection zones featuring better resolution than the EP
Magnetic Fields of Biological Objects
registration related to the same stimulation localization.
Many reports presented to the Fifth Biomagnetic Conference were
dedicated to source detection of EMRs to auditory, visual and electricstimulation of separate human nerves. There was also considered the partplayed by fissures in localizing sources of EMR because SQUID is capableof measuring only horizontal (tangential) currents and the cerebral cortexhas a columnar structure. MAGNETIC ACTIVITY OF THE NERVOUS SYSTEM OF ANIMALS
The ideology which had dominated the previous biomagnetic
conference was visibly shattered by the report from J. Beatty's laboratory(University of California, USA) on recording MEG of rats followingcreation of an epileptogenous focus [81] This type of data nourish the hopethat neurophysiologic analysis of neuromagnetic data will be used moreextensively in tests on animals with anesthesia in realization of conditionedreflexaction.
MF from the giant axon of a large lobster has been detected. The
signal was averaged 100-fold in the 0.1 Hz-5 kHz band at signal-to-hoiseratio 15. There was also reported detection of MF from Purkinje fibers ofthe heart of the dog with signal-to-noise ratio 10, and from an isolatedpapillary muscle of the heart of the rabbit [84].
The study of MF and electric field of a small strip from auricle of
the frog suspended in a vessel with electrolite revealed that: 1. MFs wereevoked by axial intracellular currents; 2. Actual correlation between thedetected electric fields and MF was fully in line with the theory; 3. Jointstudy of electric potentials distribution on electrodes and evaluation ofcurrents by their magnetic effect is a reliable method of studying dynamicsof conductivity.
The biomagnetic method was also used to perform quantitative
evaluation of the number and sizes of axons regenerating in the point of themedian nerve cutting in monkeys [84]. The method has several advantagessuch as no need to damage cellular membranes; the obtained results are notrelated to distance between tissue and electrode or to electric conductivity
of the adjoining tissues; the hazard of electrochemical action in the point ofcontact between electrode and tissue is eliminated.
There was initiated the biomagnetic research of cooperative
behavior of small sections of the brain tissue. This research provides thebridge between tests on a limited number of individual neurons andanalysis of MEG from an intact organism. Studied were components of EPand EMF to electric stimulation of dorsal surface of cerebellum of the turtlewith a manipulator used to change orientation of the preparation in the saltsolution relative the magnetic pick up coil.
It was assumed that the fast component of EMF (2-3 ms) was
elicited by direct activation of the Purkinje fibers and the late componentwas related to the post-synaptic potentials. Simultaneous registration ofEMF and EP response to cerebellar peduncle stimulation partially allowedto single out the component currents making contributions into the EMFwhich, according to the authors, reflects the antidrome action potential aswell as synaptic currents.
The other part of the above test was designed to perform magnetic
registration of proliferating depression (PD) caused by the theta-stimulationof the dorsal surface of cerebellum. Duration of the detected magneticsignal with 10 pT amplitude was 0.5-1 min while duration of the electricsignal was 2-5 min. Perhaps, the both methods reflected action of differentsources causing PD.
Another similar experiment involved study of the hippocam-pal
slice from the guinea pig [86]. The intercellular resistance to currents alongthe neurons' length estimated from the magnetic signal amplitude was 5Ohm/m.
Simultaneous extracellular magnetic and electric measurements
allow to independently estimate distribution of extracellular voltage andintercellular current. Integration of the obtained results into appropriatemathematic models makes it possible to describe the time behavior of thetransmembrane potential and to estimate the effective specific axialresistance during the action of potential proliferation.
The study of MEGs and electrocorticograms of anesthetized rats
obtained from the epileptic focus created by a penicillin injection [81]revealed that MEGs showed oscillations similar in their structure to the
Magnetic Fields of Biological Objects
epileptic discharge although the late components had a differentmorphology. An epileptiform seisure caused a slow MEG shift from themedian line similar to long electric shifts obtained from the focus with thenonpolarized electrodes.
The more detailed tests involved triggering epileptic action by
penicillin injection into medial crust of the left and right cingulumconvolution of the anesthetized rat. The authors drew a MEG map using anonmagnetic stereotaxic apparatus to rotate the test animal around thelongitudinal axis. The map was instrumental in evaluating the spatial-timemodel of cellular currents and detecting the penicillin focus of intercellularcurrents oriented perpendicular to the cortex surface i.e. along the axis ofmost of the pyramid neurons. Owing to such orientation of pyramidneurons MF polarity for each of the four components of the spike in the leftand right foci was opposite. This was in agreement with the reverseorientation of the pyramid cells in the right and left medial cortex.
Therefore, MEG provides more information to the study of
extracellular currents in the penicillin focus and aids localization of theprimary cell depolarization and hyperpolarization areas as well as directionand magnitude of intercellular currents.
This study confirmed the adequacy of the single current di-pole
model for an epileptic focus as well as the MEG measurement feasibilitywith the cylindric system of coordinates.
The spherical system of coordinates was used for the rabbit head in
the course of verifying the hypothesis on suppression of MF evoked by theradially oriented current dipole implanted in the brain [86].
Since simulations on animals may be used to study short-latent
specific responses, research of somatosensory induced magnetic field inmonkeys and cats was performed.
A conclusion can be made on the basis of this research that
neuromagnetometry of animals may provide experimental substantiation ofMEG neurogenesis as well as of a new unique method of noninvasive studyof cell population physiology.
It is quite interesting to consider in this context an assumption that
MF of stimulated nerve can promote myelinizaition of the nerve fiber. Thisassumption is also supported by high sensitivity of neuroglia to externalMF
in adult animals [59], lack of the coil effect in the glial cell culture, andincreased response of embrio and young organisms passing throughmyelinization to the impact of external increased or attenuated MF [59].
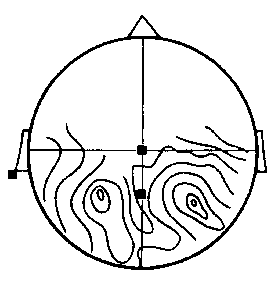
It may be concluded on the basis of these studies that an adequately
strong external MF can change orientation of the dipole created by varioussensory stimuli. This assumption issupported by the data changing under MF ofthe visual EP in the man and rabbit, andcomato-sensory EP in the rat [66]. We haverecorded MEG and EEG of the man and usedthe data to draw the alpha-band field map[18]. Spontaneous MEG was analysed withthe spectral method
Fig 28. Distribution ofMF isolines of MEG inthe alpha bandconfirming the dipolestructure of source
based on the fast Fourier transform. The results of the analysis produced awider spectrum in the low frequency delta-band as compared to EEG. These results and due account of external noise may hold much promise foridentification of the slow wave pathological activity. MEG mapping wasperformed with the covariance analysis which did confirm the dipolestructure of the alpha-rhythm source (Fig. 28).
It would be also interesting to study magnetoretionogram reflecting
the impact of external MF as it may cause visual reaction(magnetophosphene) in man. At the same time important role could beplayed in the process by magnetic properties of rhodopsin. Magneticproperties of biological objects and their oermanent MF will be discussedin the following chapters. Magnetic Fields of Biological ObjectsMAGNETIC FIELDS EVOKED BY DIRECT CURRENTS
So far we have been considering the significance of alternating MF
of biological objects (primarily of man). This is the area showing sizablecompetition between magnetography and electrography. However,discussion of properties of MF evoked by direct currents shows thatcompetition between them reduces. Magnetometry offers itself as a uniquetechnique for the evaluation of magnetic properties of biological objectsand natural or artificial inclusions.
We have already made a reference to permanent MF discussing MF
of fishes, cross-striated muscles and eye. This indicator may inform theresearcher about the action of direct or low frequency (below 0.1 Hz) skincurrents and the functioning of skeletal and smooth muscles. The last refersprimarily to muscles of the stomach. The damage potential may be one ofthe sources of permanent MF in biological objects. Perhaps, it was a sourceof MF in a wounded fish [67]. Other sources may involve the chickenembryo development and the related permanent MF [84].
Quite unexpectedly magnetic measurements revealed that
permanent magnetic field was elicited in the abdominal cavity in manfollowing a drink of cold water. Its magnitude reached 200 pT and thenslowly faded away over an hour [95]. One hour after taking meals MFgradients in the human abdomen reached 75 pT/cm and contained a numberof varying components. Following a continuous interval in eating (over 12hours) MF dropped 3-fold and became permanent in terms of time oroscillated with a 20 s period [138]. It is known that there is a 60-80 mV potential between the mucous andserous membranes of the human stomach [51]. If the stomach mucousmembrane is damaged this potential appears to be decreasing in the courseof the acid secretion process. An ability to identify this damage by MFmodification would constitute a diagnostical method free of the need toswallow unpleasant special pipes. It is also possible to stage a simpleexperiment by monitoring modifications of MF related to the secretionprocess triggered by
pharmacologic means or by administering aspirin. It would be alsointeresting to check MF modification related to the intestine smoothmuscles with the view to study intestine disfunctions [143].
It should be recalled that electrogastrography has been the most
extensively used method in the studies of electric activity of humanstomach. The technique involves administering an active electrode throughthe mouth into stomach. A passive electrode is fixed on an external part ofthe body. In these circumstances motion of the electrode inside the stomachgenerates considerable interference into the recorded signal. Coating of theelectrode by food having sizable dielectric constant, such as fat, may causethe recording to discontinue. All efforts to record human stomach potentialsworking from the body surface are hampered by signal interferencegenerated by electrochemical activity on the body - pick up electrodeborder, induction elicited by other organs such as signals evoked byintestine contraction and by electrocardiac activity. Electrical potentialsgenerated by a ventricle are distributed across the body through the volumeconductor and may be recorded from the chest surface and arms. It is hopedthat improvement of the magnetogastrographic technique will permit toconduct selective recording of currents elicited in the gastrointestinal tract.
While the study of gastromagnetism was triggered by MCG
research myomagnetism was initiated as a consequence of mag-netomyography i.e. the noninvasive method to detect bioelectrical action ofcross-striated muscles based on measurement of MF evoked by the directand alternating currents generated in the course of muscle contraction.
The first ever MMG was produced by study of human skeletal
muscles in the elbow area during the hand compression [98, 99]. Thedetected signal had both permanent and alternating MF components. Thespectral analysis of MMG showed a 40 Hz peak in measurements above theelbow and a 80 Hz peak in measurements from the palm. The MMGamplitude was about 20 pT. The amplitude of MMG recorded from theforearm was about 2 pT [97]. Barbaner et aL [84] described MMG recordedin a wide - up to 400 Hz - band from the elbow. MMG signals wererecorded in these frequencies as well. In all cases the MMG signaldisappeared in the absense of contraction of the corresponding muscles. Magnetic Fields of Biological Objects
MMG recorded from the human right leg was described by Cogg etal. [85]. Experiments were conducted with the first order SQUIDgradiometer. The pick-up coil diameter was 4.4 cm. The system'sbandwidth was 4 kHz and the background noise level was 1⋅10-13 T Hz-1/2. The human crus was used as an object of MMG waveform study. The pickup coil axis was positioned almost perpendicularly to the skin surface overthe musculus ti-bialis anterior. Wave averaging was used to produce clearlydis-cernable waves. The averaging procedure was triggerred by the presentMMG signal amplitude. As the crus MMG base line drift is small thetriggering procedure applied guaranteed reliable averaging of 32 initialrecordings. The form of MMG wave was found to be almost symmetrical. The impulse duration at one half peak height was 4 s. Asymmetric MMGwave is produced by rotating the crus 45ο around its axis. Although thefrequency spectrum of the crus MMG is similar to the one reported byCohen et al. [99] the crus MMG impulse duration was 4 s. The depth of theMMG signal source under the skin was estimated by evaluating correlationbetween amplitude of the MMG impulse and distance between skin surfaceand the dewar bottom end, measuring 1 cm.
Preliminary studies of the action potentials taken from implanted
electrodes indicated that duration of potentials elicited by one motor unit ofthe musculus tibialis anterior was 2-19 s. Since the largest MMG amplitudewas detected over the upper musculus tibialis and duration of thecorresponding MMG impulse was 10-20 s, the authors conclude that thesource of MMG in this case is a motor unit of the upper musculus tibialis.
Motions are performed, apart from extremities, by other organs of
the body. If they elicit biological currents or contain magnetic particles,motion of a particular organ may be detected with the magnetometricmethod. For example, electrooculogram (EOG) involves the use of skinsurface electrodes to record potentials elicited by eye movements. Magnetooculogram (MOG) is related to the magnetic component evokedby the eye muscles action currents. The MOG amplitude was found toreach 10-12 pT [30]. Karp et al. [121] reported that similarly to EOG,magnetooculogram is affected by variations in illumination. Modificationof the MOG permanent component related to eye adaptation to various lightconditions may measure 5 pT in several minutes.
Apart from MOG, the eye area may provide recording ofmag-
netoretinogram (MRG) measured in decimal parts of pT in response toexposing retina to light [85]. Ophthalmologists may greatly profit from theuse of these methods in their clinical research. At the same time allowanceshould be made to possible artefacts created by MF of the eye. Possibleinterference from MF of other organs should be taken into account in thecourse of every biomagnetic research.
D. Cohen et al. (1980) was the first to describe MF evoked by
currents generated in extremities. It was detected that long muscular fibersin legs and arms generate a sizable (up to 3 mA) current flowing alongextremities [101].
MF of arms is attributed to action of muscles since it was absent in
patients suffering from arms paralysis. Sizable damages of skin (scars,burns) did not affect the magnetic fields distribution. A short massage ofarms was enough to elicit currents generating these magnetic fields. No MFcreated by these currents was detected in areas devoid of any muscles(women's breast, for example).
D. Grimes et al. [85] performed research with the view to assess
the part played by ion currents in tissue regeneration. They studiedstationary MF evoked in the crus area of healthy subjects and its variationversus position of the extremity and time, as well as relation to the extent ofmuscular contraction or relaxation. The subject in the state of relaxationlaid on his back, his legs resting on a horizontal platform. Its height wasadjustable to assure maximal proximity of the subjects's legs to the pick-upcoil. Adjustment of the subject's position set conditions for detecting MFfrom the front, rear and lateral surfaces of the leg. The used method of datagathering and averaging produced the root mean square noise level of 1.10-12 T in the 0 to 40 Hz frequency range.
In spite of the measurements' variability in different subjects the
maximal field readings were detected in the area located approximately onethird of the tibia length below the dia-physis i.e. at the point of maximalarea of the muscle section. There was also reported a subject producingsignals of reverse polarity. When the subject relaxed the reading of thedetected signal increased during approximately one hour. The type ofsignals usually detected by authors of the above research easily harmonizeswith the
Magnetic Fields of Biological Objects
availability of the two oppositely oriented and spatially separated currentsflowing parallel and nonparallel with muscular fibers.
A special 2D-gradiometer capable of evaluating both the volume
and orientation of currents was used to study superficial direct currents inthe human skin [101].
It was detected that pressing a finger against a hair on the surface
on a man's head causes the 2D-gradiometer to detect currents havingidentical distribution pattern in all the inspected males. The patternremained unchanged following various impacts on man, local heatingincluded. Eliciting the 10-25 pT/cm gradient MF these direct currents flowon the headskin and center from all sides in the vertex area. They were notdetected on the forehead, ba!d spot, pubic region and under arm pits butwere well pronounced on the hairy surface of the chest. Direction of thesecurrents coinsided with orientation of hair follicles. It is practicallyunfeasible to detect this phenomenon relying only on the difference ofpotentials.
Therefore, perhaps, this is the evidence of emerging dermo-
magnetism related to studies of MF of the skin. This thrust of research maybe quite perspective for the skin is the first organ to encounter the impact ofthe environment. MAGNETIC INCLUSIONS AND MAGNETIC PROPERTIES OF BIOLOGICAL OBJECTS
It was detected that pressing a finger against a hair on the and flesh
are diamagnetic. It is known thatdiamagnetism of certain bacteria mayincrease 4% following their death [82]. Savostin [41, 59] intended toexplore the mechanism of the external MF impact on finding the matterwith magnetic susceptibility in biological objects. Research performedduring the recent decade resulted in finding natural magnetite [36, 127,128]. This line of research was dramatically expanded in the course ofosteomagnetism
study of vertebral animals. This study is well exemplified by the researchperformed by R. Baker et al [79] who used an astatic magnetometer toevaluate magnetic susceptibility of different human organs in response tothe 0.2 T MF impact. The basic results are presented in Table 5.
It may be seen from the table that magnetic properties of the human
sinuses are different from magnetic properties of other organs. It should bealso noted that magnetic properties of the pineal organ are quite differentfrom those of the other areas of the brain tissue although the authors did notgive much importance to that. It is known as well that proceeding from theneu-rophysiologic data Semm et al [141] attributed to the pineal organ amagnetic reception function.
R. Baker et al [80] also conducted the histologic study of the same
samples. High iron concentration was detected only in
Table 5Remaining Induced Magnetization of Human Tissues Representedin Electromangetic Units (EMU)
Magnetic Fields of Biological Objects
the sphenoid bone (ethmoid of the hearing complex). Iron concentrationswere shaped as 2 mem thick layers located 5 mem below the bone surfacemaking both the external and internal sinus wall. No magnetite wasdetected in the ischemia victim (this data was not included into the table). The authors maintained that the artefact magnetic contamination of thematerial could not take place.
Among the various implied physical and chemical mechanisms of
biological action of ordinary magnetic fields such as induction created byelectromotive force, modification of the cellular membrane permeability,etc. or specific fields such as optical pumping, cyclotrone effect, Josephsoneffect, etc. today more and more priority is given to the magnetitehypothesis of magnetic reception (MHMR). As a matter of fact, MHMRhas not yet been discussed in Soviet publications.
Development of this hypothesis is closely related to advances of
supersensitive magnetometry based on SQUIDs and the proofs of thebiogenic origin of magnetite as well as to dramatic expansion of thenumber of objects of magnetobiologic research.
Development Stage of Magnetite Hypothesis of Magnetic Reception
Was the first to propose the ferromagnetichypothisis of magnetic reception
Detected magnetite inthe"teeth" of chiton mollusks
Overview "Biogenic magnetite and magnetic
These three areas of scientific research have been developing primarily inreseatch centers abroad.
Table 6 presents the main stages of MHMR development.
Incidentally, many of the referred authors tend to classify their area ofresearch as biomagnetism notwithstanding the fact that this term has beenalready "engaged". They appear to be inspired by the fact that MF of theorder of 0.4 T is evoked at the magne-tosome end in magnetotacticbacteria. In our view this area of research should be rather referred to asbiogenic ferromagnetism. This is essentially the field of magnetoecologytargeting out of MF biotropic factors primarily the yector and orientation ofbiological objects.
The biogenic ferromagnetism has advanced so dramatically that
there have been discovered new bacteria types and a new organella (amagnetosome in some bacteria).
It may be seen from Table 6 that spectacular progress has been
made in the field of MHMR during 40 years of its development.
It would seem quite logical that this area of research should
organically join the mainstream of the modern research of biomagnetismand provide a reliable link between biomagnetism and magnetobiology.
So far, the search for the natural magnetite has been mainly the
concern of geologists and zoologists while biomagnetism continues to bethe hobby of physicists and clinic physicians. The general report onbiomagnetism by Kirshvink was presented during the workshop in Italy[85] but the subject was not yet included in the program of the conferences.
At the same time conferences on biomagnetism did discuss the
problems ofpneumomagnetism which, to put it straight, were artificiallyinvolved into the modern biomagnetism. It might have happened becauseD. Cohen [91] while studying MCG accidentally discovered artificialmagnetic inclusions in lungs of some subjects. Thus, pneumomagnetismwhich will be further discussed below has joined the family of modernbiomagnetism despite the fact that the true "relative" (the search for naturalmagnetite inclusions) remains quite neglected and the problem of magnetictransport of medicines [52] similar to matters of pneumomagnetism areoverlooked in the course of discussions at biomagnetic conferences. Magnetic Fields of Biological Objects
To be consistent one should separate the study of artificial
magnetic inclusions in biological objects from biomagnetism (since it is nota magnetism of biologic origin) and classify it into pneumomagnetism,vasomagnetism (magnetic transport of medicines via the blood channel)and gastromagnetism (dealing with magnetic inclusions in the digestivetract). In the last case it might be possible to determine whether a personused the food contained in a tin or in another packing [95].
Natural magnetic inclusions in the human nasal bone are covered
I .Sinus bones are an element of iron depot. A case of anemic
subject indicates that the material is absent when the subject developsdeficit of iron.
2. Magnetic deviations are related to perception of external
3. Magnetic material is related to growth and regeneration of
bones. These hypotheses do not contradict one another and their substantiationrequires further research.
It should be also mentioned that liver is the principal local depot of
iron in man. Various diseases may cause the iron concentration to raise orfall. Introduction into clinical practice and regular use of SQUID fordiagnostical purposes is instrumental in quantitative evaluation of liver irondeficit or excess. This method features sizable advantages over othertechniques. So, hepatomagnetism has every reason to become a promisingmagnetometric method.
Natural magnetic inclusions were also detected in human adrenal
glands [123, 128]. Nevertheless, this report remained aside of the flow ofinformation (coming as a magnetic boom) on magnetite contents in theskull bones. The use of magnetometric method in tests of pigeon brainsection initially exposed to MF was instrumental in detecting naturalmagnetic materials between dura mater and the skull. These data supportedthe idea that pigeons use information on the geomagnetic field to orientthemselves in space. There was also proposed the idea on possible ironaccumulation in the pigeon's head from blood erythro-cites [124].
It would be appropriate in this context to recall some incomplete
data on geomagnetism. It was known as far back as in 1930's that
deoxygenated hemoglobin's magnetic susceptibility falls by 7%. V. Karmilov writes in his review that patients suffering from cancer showcertain modification of blood magnetic properties. A. Chizhevsky [68]offered theoretical substantiation of possible magnetic interaction ofrotating erythrocites. M. Muroyama [129] reported that a strong enoughpermanent external MF does not affect erythrocites in a healthy humansubject but tends to orient erythrocites of a patient suffering from sickle-cell anemia. Having studied the human blood erythrocites behavior inexternal MF a group of Soviet physicists concluded that magneticsusceptibility of a living cell is the function of its physiologic state and thatstudies of this parameter are particularly important to designing newmethods of medical diagnosis.*
Similar conclusions were also made by other researchers following
examination of the same biological object [36, 70, 130].
Magnetic susceptibility is best studied in bacteria because in some
bacteria species there were detected magnetic inclusions [87] and specificorganellas-magnetosomes [128]. Some features of these bacteria andorganellas are presented in Table 7 quoted from a publication by Denhametal [104]. As a rule bacteria have a linear chain of 20 cubiccal particlesrich in iron with side measuring to the order of 50 nanometers. Togetherwith Kalmijn he noted that bacteria contained a permanent magnetic dipole. And finally, using the Mossbauer spectroscopy Frankel and Blakemorereported that iron granules were composed of magnetite (F3O4) oftenreferred to as black iron ore. Each granule was coated with membrane orshell. Blakemore and his colleagues named them magnetosomes. Theyaccount for about 2% of dry weight of bacteria and contain 10 to 100 timesmore iron than nonmagnetotactic bacteria [128].
The magnetosome chain is large enough to have a substantial
magnetic moment which may explain appropriate orientation of bacteriafrom the point of physics. For example, dead bacteria maintain theirorientation along magnetic power lines. When living bacteria floatorientation forces
_____________________* Kondorsky E., Shalygin A., XV All-Union Conference on the Physics of MagneticPhenomena, Perm,1981, p. I, p. 144 (in Russian) [26]. Magnetic Fields of Biological Objects
them to move along the magnetic field power lines. Field lines in thenorthern hemisphere are inclined down in such a way that movement to theNorth pole amounts to movement in depth. Blakemore maintains thatmagnetotaxis may orient the bacteria to the bottom and low oxygensediments where they feel better off.
In order to verify this hypothesis Blakemore et al. collected in 1980
bacteria from sediments in New Zealand and Tasmania. This area featuresthe same magnetic inclination as New England, but of opposite polarity. Itwas established that bacteria were oriented primarily to the south whichwas again the sign of movement to the bottom. Working independentlyfrom Blakemore Kirshvink found the south-oriented bacteria in Australia.
Subsequently, Frankel and Blakemore gathered bacteria at the
magnetic equator in Brazil where magnetic power lines go parallel to theEarth's surface. There they found approximately equal quantities of bacteriaoriented to the north and south [112].
By now Blakemore et al. have determined about a dozen
morphologically different bacteria possessing magnetosomes. Some ofthem, such as Aquaspirillum magnetotacticum are the only species existingas a pure bacterial culture. On both ends they have flagellums allowingthem to swim in any direction along the field lines. Blakemore et aL alsoreported that they are sensitive to oxygen and usually swim along the fieldlines if there is an optimal oxygen concentration. Many researcherspresently study bacterial physiology and determine a'mong other things themechanism responsible for magnetosome formation and the role played byiron in the electron transport.
This approach was quite successful in the field of phyto-
magnetism. Discovery of magnetotaxis in green algae was reported byFrankel et al [128]. Algae of the genus Chlamydomonas were extractedfrom the polluted coastal lagoon of the Rio de Janeiro river. They weresouth-oriented and showed the same reaction as bacteria. Passiveorientation of the cells was exercised through their magnetic momentwhich, incidentally, was 10 times higher than in bacteria. However, theresearchers did not have enough time to grow an adequate quantity of algaein culture to determine the position of magnetite in cells. Subsequently,similar but north-oriented bacteria were found by Frankel as well. All thesediscoveries are the first solid evidence of
magnetotaxis in eukaryotic organisms. (Bacteria are prokaryotic and haveno cell nuclei and certain other intracellular organellas while algae andsupreme organisms belong to eukaryotes and have all such elements).
The function of magnetotaxis in algae is yet unclear although it is
already known that Chlamydomonas may be heterotrophs or autotrophswhich implies that they can either absorb all their feed from the aquaticenvironment or produce a part of it by photosynthesis. Frankel maintainedthat magnetotactic algae enjoy certain advantages in the process ofoccupying heterotrophic niches in their environment. Negative phototaxis(migration away from light) was earlier noticed in Chlamydomonas [128].
Several researchers found magnetite in other eukaryotes. This is
already the field of zoomagnetism. Fuller et al reported magnetitediscovery in heads of four dolphins. It was found between the dura materand skull i.e. in the same place as in the head of pigeon. Subsequently,Fuller and Zoger detected magnetite in the same place in the head of theCuvier whale. (All tests were performed on dead whales which threwthemselves ashore and were designated for the Natural History Museum,Los Angeles).
Magnetic particles were also detected in tuna, blue marlin and
green turtle. In turtles magnetic paricles penetrated all tissues although intuna and marlin they were concentrated in the ethmoid cavity involvingwall bones and nasal septum. Therefore, it was more or less the samemagnetite-containing area as in dolphins or pigeons. Baker et al [80]reported detection of magnetite in ethmoid cavity ofrhodents and humans. Kirschvink [124] reported the same localization in monkeys. In all casesresearchers noted that magnetic particles were surrounded by nervous tissuepointing out to possible interaction between the particles and the brain.
Detection of MF of the nerve is just one example of
cytomagnetism. Kirschvink et al observed residual magnetism in two typesof tumor in mice: US-8 lymphoma and Lewis lung tumor. Human tissues ofthe stomach, intestine and kidney carcinoma showed no substantial residualmagnetism similarly to tissues of healthy mice. Magnetic Fields of Biological Objects
Many researchers detected that cells of tumors in mice contained
approximately five magnetite particles per cell (estimated by their magneticmoment) as compared to less than one particle per thousand cells in humantumors and other tissues. Gabrah and Batkin exposed cultivated tumors tovarious MFs to evaluate their impact on tumor growth. The Lewis tumordid not react to external MF while US-8 cells showed noticeable response. The impact of MF of the order of mT and 2000 Hz increased the cells'growth dramatically while the impact of the same MF but of 60 Hzconsiderably inhibited their growth. Today, many researchers are trying topinpoint location of particles inside the cells as well as to evaluate otherpossible functions they perform apart from storing iron [128].
It may be seen from Table 7 [104] that presence of mag-netosomes
containing almost all magnetite is the principal distinction of magnetotacticbacteria. Discovery of these orga-nellas is an important accomplishment ofthe modern biomagnetism as it incorporates this lateral biophysicalproblem into the mainstream of microbiology.
No matter how strong we are carried away by consideration of
magnetosomes we should avoid the conclusion that these organellas are theonly instrument of response to external MF. Measurement of magneticsusceptibility of nonmag-netotactic bacteria, performed by S. Pavlovich[33] with the Gouy's technique, determined variability of magneticsusceptibility
Certain Magnetic Characteristics of Bacteria
of microorganisms (which may be attributed to uneven content of dia- andparamagnetic particles or to special chemical composition of theintercellular organellas) and its modification following a 70-days storage ofbacteria in the pulsating at 3 min. intervals MF with induction of the orderof 500 mcT (Table 8).
According to the data of this table bacteria numbered 6, 7, 10, 12,
13, and 14 possessed the lowest magnetic susceptibility and thosenumbered 2, 5, and 8 had the highest susceptibility. Thus, bacteria ofvarious types differ in terms of the summary magnetic susceptibility.
Following MF impact the summary magnetic susceptibility
dropped 22.6% as against control in Micrococcus lisodicticus and 40% inE. coli R678. At the same time magnetic susceptibility of dry biomassincreased according to reliable data 4-19% in Salm. typhimurium, Salm. cholera, E. coli C-85, E. coli C-H2. Bact. subtilis and Proteus vulgaris.
Magnetic Susceptibility of Certain Bacteria and Variation after Keeping Bacteriain Magnetic Field [33]
Magnetic Fields of Biological Objects
Magnetic susceptibility of the other six types of studied bacteria did notchange at the impact of MF with specified parameters.
Thus, magnetic susceptibility of cellular matter continuously stored
in a weakly pulsating MF tended to increase in over one third of testmicrobes. Interestingly, the population of magnetosensitive bacteria generais heterogenous in terms of its magnetic susceptibility and clones featuringhigh paramagnetism may account for a high percentage of magneticdissociants. Therefore, magnetic susceptibility may be regarded as animportant means of exploring magnetic variability of microorganismsinduced by variations of the geomagnetic field.
The use of EPR technique to study dynamics of magnetic
properties of yeast was instrumental in detecting signal increment 30minutes after the onset of its cultivation. Subsequently, the signal intensitychanged periodically over 6-7 hours, then sharply dropped and increasedagain in 8-10 hours. The growth of yeast was usually completed by thattime. Interestingly, the dynamics of magnetic properties of yeast basicallycorresponds to its susceptibility to external MFs [59].
Concluding the present review of the current state-of-the-art of
bacteriomagnetism we should stress that presently the main objective is tosystematize the dislocated material dedicated to assessment ofsusceptibility in the course of various research. For example, A. Pavlovichperformed a many-year cycle of magnetobiological tests focusing onmicroorganisms as the main test object. Study of mechanisms responsiblefor magnetobiological processes and the related research generated the needfor biomagnetic research. Being undisputably original and indispensablethis approach goes to underline the theoretical significance of this thrust ofresearch.
The practical dimension of this scientific branch envisages the use
of biomagnetic data for diagnosis, assessment of variability of macro- andmicroorganisms, evaluation of magnetic sensitivity of biological objects,identification of the hygienic role of physical factors, etc. The list of itspractical uses could be very long because this research is related tofunctional problems of biology, medicine and biotechnology.
The last area also involves methods to identify artificial magnetic
inclusions in biological systems. These methods facilitate betterunderstanding and make more visible as compared with other branches
of biomagnetism signal sources detected in the course of studying magneticinclusions in lungs of humans and animals. This subject was extensivelycovered in many publications [119]. This research may be performed bothwith SQUIDs and FMs because the signal is sufficiently large.
These publications clearly show the hygienic thrust of research
(evaluation of iron content in lungs of individuals working in contact withiron dust). The countries where such studies have been originallyperformed began to produce mobile labs in coaches and carry out masscheckups. The use of magnetometry to assess the degree of lungscontamination is more accurate and safer than, for instance, the radiologicalmethod.
The study of clearance i.e. evacuation of iron dust artificially
administered into lungs indicated, at least according to publications by A. Freedman et al. [109], that iron is evacuated from nonsmokers two timesfaster than from smoking individuals. It was also noted that functions ofdeep parts of lungs are disturbed only in smokers.
The subjects were first exposed to external MF and then the lung
area was sweeped by magnetometer. The resulting maps produced the dataon quantity, localization and speed of magnetic dust evacuation fromsubjects suffering from occupational diseases and from smokers.
For example, tests performed on smokers and nonsmokers revealed
that after II months since administering a harmless magnetic powder intolungs 50% of it remained in lungs of smokers and only 10% in nonsmokers. Thus, the technique appears to be instrumental in noninvasive evaluation oflung contamination by ferromagnetic elements.
Removal of these particles usually takes one year. Besides, the new
method is more reliable than the radiological and other methods. Owing toits complete safety and relative cheapness it may be used in check upsalready now or assist solution of many environmental problems related topollution of water, air, food, etc. by ferromagnetic particles.
Several researchers from different countries reported the
participation of phagocytes in the process of iron evacuation from thelungs. Magnetic Fields of Biological Objects
Phagocytes were found to use such intercellular formations as
mitochondria and microtubes. The tests were performed on animals(hamsters and rats). Test results were presented as histologic sectionsvividly showing correctness of scientific conclusions.
Pneumomagnetism may be regarded as the most advanced area of
anthropogenic biomagnetism (in contrast to biogenic biomagnetism) bothin terms of extensive use of techniques for evaluation of artificial magneticinclusions in the lungs, and histochemical research by administering andevacuating magnetic inclusions. Perhaps, researchers working in thisparticular area could be criticized for lack of coordination between theirstudies and vaso- and gastromagnetism where similar problems could befaced. Particular interest is invited to magnetic transport of medicinesthrough the blood, respiratory and digestive tracts. So far, only the bloodchannel has been studied in this sense [52].
Anthropogenic biomagnetism should also master the ability to
solve magnetobiological problems i.e. accommodate possible biologicalinfluence of external MFs [35, 39, 57, 59, 66, 73].
EMS CLASSIFICATIONS FACT SHEET Date of implementation to be the start of the pay period following three calendar months after date of ratification. Proposed EMT I Classification Transition Strategy • In order to be employed at a Technician Paramedic level employees must possess • EMT I employees who do not attain a Technician Paramedic license will be placed in a Technician pos
Pressedienst Weilburger Tageblatt – 23.04.13 VON MARGIT BACH Politik spielt keine Rolle UMFRAGE Jugendpflegen stellen Projektergebnisse in Obertiefenbach vor Beselich-Obertiefenbach. "Klappe auf! Jugend redet mit" ist das Motto eines Projektes gewesen, dass die Kommunen Merenberg und Waldbrunn vor ei-nem Jahr gestartet haben. Der Ab-schluss dieses Projekts fan
 in adult animals [59], lack of the coil effect in the glial cell culture, andincreased response of embrio and young organisms passing throughmyelinization to the impact of external increased or attenuated MF [59].